Phys. Rev. Lett. 90 095502 - APS Link Manager - American Physical ...
Phys. Rev. Lett. 90 095502 - APS Link Manager - American Physical ...
Phys. Rev. Lett. 90 095502 - APS Link Manager - American Physical ...

You also want an ePaper? Increase the reach of your titles
YUMPU automatically turns print PDFs into web optimized ePapers that Google loves.
VOLUME <strong>90</strong>, NUMBER 9PHYSICAL REVIEW LETTERS week ending7 MARCH 2003Observation of the Onset of Strong Scattering on High Frequency Acoustic Phononsin Densified Silica GlassB. Rufflé, 1 M. Foret, 1 E. Courtens, 1 R. Vacher, 1 and G. Monaco 21 Laboratoire des Verres, UMR 5587 CNRS, Université Montpellier 2, F-34095 Montpellier, France2 European Synchrotron Radiation Facility, Boîte Postale 220, F-38043 Grenoble, France(Received 30 August 2002; published 3 March 2003)The linewidth of longitudinal acoustic waves in densified silica glass is obtained by inelastic x-rayscattering. It increases with a high power of the frequency up to a crossover where the wavesexperience strong scattering. We find that is at least 4, and probably larger. Resonance andhybridization of acoustic waves with the boson-peak modes seems to be a more likely explanationfor these findings than Rayleigh scattering from disorder.DOI: 10.1103/<strong>Phys</strong><strong>Rev</strong><strong>Lett</strong>.<strong>90</strong>.<strong>095502</strong>PACS numbers: 63.50.+x, 78.35.+c, 61.43.–j, 78.70.CkA controversy regarding the fate of very highfrequency acousticlike excitations in glasses arose inrecent years [1,2]. Acoustic waves propagate in glassesup to rather high frequencies, for example, up to at least=2 ’ 0:4 THz in vitreous silica, v-SiO 2 [3,4].However, silica shows a pronounced ‘‘plateau’’ in thetemperature (T) dependence of its thermal conductivityT [5]. This feature was explained by postulating theexistence of a rapid crossover of acoustic waves into aregime where they experience strong scattering [6]. Inv-SiO 2 , this crossover is expected at a frequencyco=2 ’ 1 THz [7]. For the observed horizontal plateauto occur, besides strong scattering of thermal phonons,phonons of lower must also experience a sufficientlystrong T-independent scattering [8]. Several models predictthat the inhomogeneous width of acoustic waves canincrease with a high power of , typically in 4 [9,10],leading to this rapid crossover. However, the origin of thehigh power remained debated, whether Rayleigh scatteringfrom structural defects [6], or resonance with localmodes [10–12]. Rayleigh scattering seems generally tooweak in materials as homogeneous as dense glasses to beable to account for the relatively low co suggested by theposition of the plateau [6,8]. The local modes are seen inthe ‘‘boson peak’’ (BP) and produce an excess over theDebye specific heat [13]. Successful models based onresonance or on soft potentials were developed to describethe observed properties, e.g., in [10,14,15].It might seem, judging from some recent literature [2],that the above picture should have been revised after itbecame possible to observe in glasses the spectrum oflongitudinal acoustic (LA) waves at THz frequencieswith x-ray Brillouin scattering (BS) [16]. This new experimentaltool is important here, as it potentially allowsone to check some of the previous conjectures. It led tomany publications claiming to prove that sound propagatesat frequencies much above the earlier expectationsfor co, e.g., [17,18]. In this respect, it must be emphasizedthat inelastic x-ray scattering (IXS) still is a difficultspectroscopy with severe limitations on resolutionand intensity. First, it is practically not possible withcurrent instruments to investigate scattering vectors Qbelow 1nm 1 , a value which happens to coincide withthe expected wave vector q at crossover, q co ,inv-SiO 2 [7]and in many other glasses. Second, the narrowest instrumentalprofile allowing for sufficient intensity [19] stillhas an energy width around 1.5 meV (or ’ 0:4 THz) andextended Lorentzian-like wings. Owing to the relativelystrong elastic scattering of glasses, this tends to mask theweaker Brillouin signal. For these reasons it is still notpossible to investigate with IXS the LAwaves of v-SiO 2 atfrequencies where their linewidth might grow in4[20,21]. Finally, the signal-to-noise ratio being also small,the subtle changes in BS line shapes that indicate strongscattering might easily go unnoticed [22]. To alleviateseveral of these difficulties, we investigated permanentlydensified silica glass, d-SiO 2 , in which co=2 ’ 2 THzand q co ’ 2nm 1 [23,24]. A clear demonstration of arapid increase of the LA width as approaches cofrom below is still missing. This is a crucial check forthe onset of strong scattering. It is all the more importantthat many recent <strong>Lett</strong>ers advocated acoustic linewidthsthat vary as Q 2 up to very high Q values, denying theonset of strong scattering and the existence of the correspondingcrossover, e.g., [17,18,25–29]. In this <strong>Lett</strong>er, weuse the window between the smallest accessible Q and theq co of d-SiO 2 to study the approach of the crossover. Wefind a width in with at least equal to 4 and probablylarger, corroborating the early intuition of a rapid crossoverto strong scattering.The experiments were performed on the highresolutionIXS spectrometer ID16 at the EuropeanSynchrotron Radiation Facility in Grenoble, France.The x-ray energy is 21.7 keV. The main components ofthe spectrometer are a T-scanned monochromator, thesample, a battery of five T-stabilized spherical analyzers,and the corresponding detectors. The instrumental lineshape was determined for each analyzer behind its standardslit of 20 60 mm (width height), using the signalfrom the first sharp diffraction peak of polymethyl<strong>095502</strong>-1 0031-<strong>90</strong>07=03=<strong>90</strong>(9)=<strong>095502</strong>(4)$20.00 © 2003 The <strong>American</strong> <strong>Phys</strong>ical Society <strong>095502</strong>-1
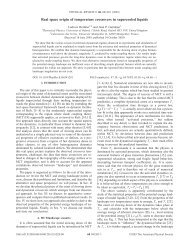
VOLUME <strong>90</strong>, NUMBER 9PHYSICAL REVIEW LETTERS week ending7 MARCH 2003methacrylate at 20 K. Very clean Voigt-like shapes wereobtained with half widths at half maximum of ’0:75 meV. The analyzers permit data collection at fiveQ in increments of ’ 3nm 1 . As we are now interested insmall Q, the first analyzer was placed to the left of theforward direction, and the second to the right. This allowssimultaneous collection of two interesting data pointswith Q 2nm 1 . The data presented here were thusacquired with only three different positions of the firstanalyzer, j Q j 2, 1.8, and 1:6 nm 1 . Each spectrum wasaccumulated for nearly two full days. The sample ofd-SiO 2 , of density 2:62 g=cm 3 , is the same as in previousmeasurements [23,24]. It is heated at 565 K to increase theinelastic signal. At this T, the densified structure doesnot relax. This was subsequently checked with optical BS,the sound velocity providing a sensitive test for thedensity [23].Figure 1 illustrates typical spectra and their fits. Theindicated values of Q correspond to the center of thecollection slit which gives a spread Q ’ 0:18 nm 1 .The spectra consist of a strong elastic peak plus a weakerBrillouin doublet. In Fig. 1(a), the full raw spectrum isshown for the smallest usable Q, namely, Q 1:17 nm 1[30]. The dashed line follows the elastic peak, illustratingthe relative weakness of the doublet. To extract informationon the position and half-width , the spectra arefirst adjusted to a damped harmonic oscillator (DHO)profile plus an elastic central peak (CP), convolutedwith the instrumental function. Account is taken of thebroadening due to the collection angle by summing overcontributions from surface elements of the slit, each at itsown Q, using d =dQ v g . Here v g is the group velocitywhich is determined iteratively. There are four free parametersin the fits: the integrated intensities of the elastic(I CP ) and inelastic (I DHO ) components, and .Thesmall background shown by the baselines is fixed to thedetector noise, measured independently. Figures 1(b) and1(c) illustrate, for the two extreme values of Q measuredbelow crossover, the inelastic part that remains aftersubtraction of the adjusted elastic contribution I CP .Thesolid lines are the DHO fits. In Fig. 1(b) the width ismostly instrumental, while in 1(c) it is due in large part toa real broadening of the Brillouin signal.The values obtained for are shown in Fig. 2 againstthose for which agree with [23]. increases veryrapidly with . There should be a homogeneous broadeningcontribution to this width, hom. It is estimatedfrom hom / 2 by extrapolation of an optical BSdetermination, hom=2 26 5 MHz for =241:5 GHz at 600 K [31]. Interestingly, in that BS experimentthe linewidths of d-SiO 2 are very near those ofcrystal quartz over a broad range of T, whereas the linewidthsof v-SiO 2 are typically 4 times larger. Thus, itseems reasonable to assume hom / 2 , as, e.g., theAkhiezer mechanism might extend up to the THz regionin d-SiO 2 at these elevated T values. This gives the homIntensities [Counts per channel in <strong>90</strong>s]40 (a)20Q = 1.17 nm -1DHO020 (b) Q = 1.17 nm -10100010 (e)DHO(c) Q = 1.8 nm -1DHO10 (d) Q = 1.8 nm -15EMAQ = 4.2 nm -1DHO010 (f) Q = 4.2 nm -15EMA0-30 -20 -10 0 10 20 30X-Ray Energy Loss [meV]FIG. 1. IXS spectra of d-SiO 2 and their fits explained in thetext: (a) a full spectrum and its central portion 1=20;(b),(c),(e) damped harmonic oscillator (DHO) fits of the inelasticpart after subtraction of a central peak (CP) freelyadjusted in the fits; (d),(f) effective-medium-approximation(EMA) fits of the inelastic part after subtraction of a CP alsofreely adjusted.drawn in Fig. 2. The total rate is then approximated byMatthiesen’s rule of adding rates due to independentprocesses, hom inh [21]. The inhomogeneousscattering width is adjusted to inh / . A fit of thefive measured points with this expression gives the solidline in Fig. 2 with 4:21 0:15, and 2 0:76. Forcomparison, if we force 2, the best fit shown by the2dotted line gives 5:4.The inelastic intensities, I DHO , derived from these fitsare shown in the inset of Fig. 2. With the very clean<strong>095502</strong>-2 <strong>095502</strong>-2
VOLUME <strong>90</strong>, NUMBER 9PHYSICAL REVIEW LETTERS week ending7 MARCH 2003FIG. 2. The linewidths extracted from DHO fits. homextrapolated from optical Brillouin scattering is shown bya full line terminated by dots. A full line ( 4:2) showsthe fit to hom inh . The dashed line ( 5:7) is the samefit restricted to the four lowest data points. The dotted lineillustrates the best fit with 2, i.e., with 2 . The inset showsthe total inelastic intensities (dots) normalized to 5 h accumulationon the best analyzer (#2) compared to a line / vLA 2.instrumental profile and the long accumulation times,these are much more significant than previous ones [23].They are compared to vLA 2 (line), where v LA =Q isthe phase velocity determined in this experiment. Theline is scaled to coincide with the most precise low Qpoint. One notes an excess in the observed I DHO whichgrows as Q approaches q co . One should ask whether this isdue to the use of the DHO instead of the more appropriateeffective-medium-approximation (EMA) line shape [23].To investigate this we adjust all spectra to the EMA,including those obtained above q co on the other detectors.We find that h co 8:5 meV gives a good overall adjustmentwith the other parameters as in [23]. With theseparameters fixed, there remain only the intensities I EMAand I CP to fit each individual spectrum. At small Q, forexample, for Q 1:17 nm 1 , the EMA and the DHO areequivalent. On the other hand, for Q q co , the EMA issuperior as shown in Figs. 1(e) and 1(f). This particularspectrum is the average of three similar spectra acquiredon the third analyzer at Q 4, 4.2,and4:4 nm 1 , for atotal counting time of nearly one week. The three spectrawere independently fitted and then added, reducing thesize of the error bars. Figure 1(e) shows that the DHOdemands a larger signal at small ! than the EMA inFig. 1(f). The fit adjusts this by using a smaller I CP forthe DHO, but this is not able to represent properly theprofile. Below q co , a similar comparison is shown inFigs. 1(c) and 1(d). One notices the same trend. However,this is not the reason for the excess intensity.Indeed, we find that I DHO ’ I EMA well within the errorbars for all five data points. The small dip in the center ofthe EMA fits is compensated by their more extendedwings. The intensity excess seems thus real. For thepresent discussion, the main virtue of the EMA is toprovide a fair estimate for co. There is, of course, noto be extracted from this EMAwhich postulates 4.We now remark that the highest point in Fig. 2 is nearlyat co. Owing to the Ioffe-Regel saturation of the damping,one cannot expect that inh / extends up to thispoint. The saturation of inh is an important aspect of theEMA [23]. Therefore, it is more reasonable to fit only thelowest four points to the power law. The result is shown bythe dashed line in Fig. 2, which corresponds to 5:71:0 with20:28. The extrapolation of this fit to thehighest point gives a inh nearly equal to twice the observedone. This is precisely the saturation expected nearcrossover [23]. The value of obtained in this mannerdoes not change by allowing for the uncertainty in hom ,only its uncertainty increases slightly. If is really solarge, the onset of strong scattering of sound cannot bedue to Rayleigh scattering from structural inhomogeneitieswhich give 4 [9].Resonance of sound with pointlike local modes, assuminga bilinear coupling, leads to inh / ,where is the mode density of states (DOS) [10,14].Figure 3 shows the DOS of d-SiO 2 taken from [32] aftersubtraction of a Debye contribution of 1:44 10 5h 2 , with h in meV. The BP, = 2 , with itsmaximum near co [24], is also shown. The values ofinh and are drawn on the same plot for comparison.They increase together with but do not seem exactlyproportional to . There can be several reasons for this.One is that an exact determination of with neutronscattering is always a difficult task, especially for d-SiO 2as a large sample can contain a few less densifiedfragments. Another possible reason is more profound. Insilica the BP relates to rigid tetrahedra rotations [33]FIG. 3. The DOS of the local modes (squares) extracted fromneutron scattering data [32] compared to inh (dots) and(triangles). For illustration the boson peak calculated from thisDOS is shown by the full line in 10 5 meV 3 .<strong>095502</strong>-3 <strong>095502</strong>-3
VOLUME <strong>90</strong>, NUMBER 9PHYSICAL REVIEW LETTERS week ending7 MARCH 2003with q