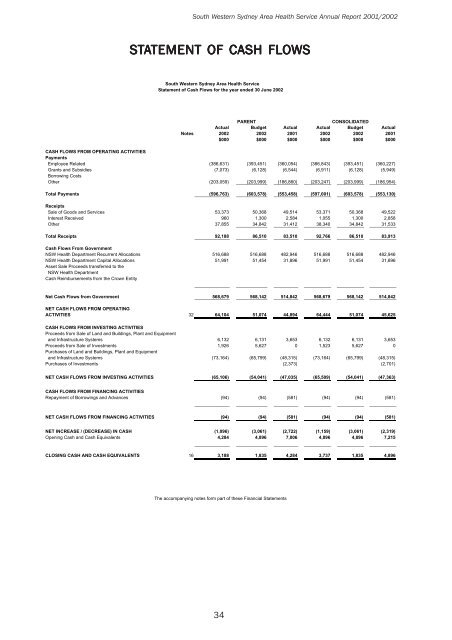
South Western <strong>Sydney</strong> Area <strong>Health</strong> Service <strong>Annual</strong> <strong>Report</strong> <strong>2001</strong>/20<strong>02</strong>STATEMENT TEMENT OF CASH FLOWSSouth Western <strong>Sydney</strong> Area <strong>Health</strong> ServiceStatement of Cash Flows for the year ended 30 June 20<strong>02</strong>PARENTCONSOLIDATEDActual Budget Actual Actual Budget ActualNotes 20<strong>02</strong> 20<strong>02</strong> <strong>2001</strong> 20<strong>02</strong> 20<strong>02</strong> <strong>2001</strong>$000 $000 $000 $000 $000 $000CASH FLOWS FROM OPERATING ACTIVITIESPaymentsEmployee Related (386,631) (393,451) (360,054) (386,843) (393,451) (360,227)Grants and Subsidies (7,073) (6,128) (6,544) (6,911) (6,128) (5,949)Borrowing CostsOther (203,059) (203,999) (186,860) (203,247) (203,999) (186,954)Total Payments (596,763) (603,578) (553,458) (597,001) (603,578) (553,130)ReceiptsSale of Goods and Services 53,373 50,368 49,514 53,371 50,368 49,522Interest Received 960 1,300 2,584 1,055 1,300 2,858Other 37,855 34,842 31,412 38,340 34,842 31,533Total Receipts 92,188 86,510 83,510 92,766 86,510 83,913Cash Flows From Government<strong>NSW</strong> <strong>Health</strong> Department Recurrent Allocations 516,688 516,688 482,946 516,688 516,688 482,946<strong>NSW</strong> <strong>Health</strong> Department Capital Allocations 51,991 51,454 31,896 51,991 51,454 31,896Asset Sale Proceeds transferred to the<strong>NSW</strong> <strong>Health</strong> DepartmentCash Reimbursements from the Crown EntityNet Cash Flows from Government 568,679 568,142 514,842 568,679 568,142 514,842NET CASH FLOWS FROM OPERATINGACTIVITIES 32 64,104 51,074 44,894 64,444 51,074 45,625CASH FLOWS FROM INVESTING ACTIVITIESProceeds from Sale of Land and Buildings, Plant and Equipmentand Infrastructure Systems 6,132 6,131 3,653 6,132 6,131 3,653Proceeds from Sale of Investments 1,926 5,627 0 1,523 5,627 0Purchases of Land and Buildings, Plant and Equipmentand Infrastructure Systems (73,164) (65,799) (48,315) (73,164) (65,799) (48,315)Purchases of Investments (2,373) (2,701)NET CASH FLOWS FROM INVESTING ACTIVITIES (65,106) (54,041) (47,035) (65,509) (54,041) (47,363)CASH FLOWS FROM FINANCING ACTIVITIESRepayment of Borrowings and Advances (94) (94) (581) (94) (94) (581)NET CASH FLOWS FROM FINANCING ACTIVITIES (94) (94) (581) (94) (94) (581)NET INCREASE / (DECREASE) IN CASH (1,096) (3,061) (2,722) (1,159) (3,061) (2,319)Opening Cash and Cash Equivalents 4,284 4,896 7,006 4,896 4,896 7,215CLOSING CASH AND CASH EQUIVALENTS 16 3,188 1,835 4,284 3,737 1,835 4,896The accompanying notes form part of these Financial Statements34
South Western <strong>Sydney</strong> Area <strong>Health</strong> Service <strong>Annual</strong> <strong>Report</strong> <strong>2001</strong>/20<strong>02</strong>PROGRAM STATEMENT TEMENT - EXPENSES & REVENUESSouth Western <strong>Sydney</strong> Area <strong>Health</strong> ServiceProgram Statement - Expenses and Revenuesfor the Year Ended 30 June 20<strong>02</strong>SERVICE'S EXPENSES AND Program Program Program Program Program Program Program Program Program Program TotalREVENUES 1.1 * 1.2 * 1.3 * 2.1 * 2.2 * 2.3 * 3.1 * 4.1 * 5.1 * 6.1 *20<strong>02</strong> <strong>2001</strong> 20<strong>02</strong> <strong>2001</strong> 20<strong>02</strong> <strong>2001</strong> 20<strong>02</strong> <strong>2001</strong> 20<strong>02</strong> <strong>2001</strong> 20<strong>02</strong> <strong>2001</strong> 20<strong>02</strong> <strong>2001</strong> 20<strong>02</strong> <strong>2001</strong> 20<strong>02</strong> <strong>2001</strong> 20<strong>02</strong> <strong>2001</strong> 20<strong>02</strong> <strong>2001</strong>$000 $000 $000 $000 $000 $000 $000 $000 $000 $000 $000 $000 $000 $000 $000 $000 $000 $000 $000 $000 $000 $000ExpensesOperating ExpensesEmployee Related 48,107 49,660 964 1,589 39,597 43,007 31,918 30,238 174,251 157,240 26,966 24,830 31,674 27,494 40,845 38,359 8,011 6,289 18,057 13,352 420,390 392,058Visiting Medical Officers 198 220 0 3,811 1,277 645 606 20,469 19,380 2,296 4,408 1,141 698 873 772 238 0 3 0 29,674 27,361Goods and Services 11,090 6,004 94 500 14,958 6,672 8,636 8,577 126,131 123,387 25,755 25,768 4,648 4,443 11,542 13,755 2,311 1,420 3,047 2,312 208,212 192,838Maintenance 2,319 2,841 30 25 2,206 2,860 1,401 1,139 7,804 6,975 1,300 1,309 1,970 1,140 1,658 1,562 412 255 437 398 19,537 18,504Depreciation and Amortisation 5,655 3,917 72 7 4,272 2,814 2,618 1,718 13,555 9,396 2,052 1,264 1,970 929 3,937 2,614 287 131 747 437 35,165 23,227Grants and Subsidies 4,777 5,085 36 0 23 0 10 0 67 0 12 0 63 154 1,066 14,617 157 0 145 0 6,356 19,856Borrowing Costs 0 0 0 0 0 0 0 0 0 0 0 0Payments to Affiliated <strong>Health</strong> Organisations 3,514 11,539 15,053 0Other Expenses 0 0Total Expenses 75,660 67,727 1,196 2,121 64,867 56,630 45,228 42,278 342,277 316,378 58,381 57,579 41,466 34,858 71,460 71,679 11,416 8,095 22,436 16,499 734,387 673,844RevenueSale of Goods and Services 1,594 1,304 4 3 2,011 1,672 1,814 1,549 55,719 50,323 10,521 9,487 2,934 2,543 8,248 8,461 38 34 49 45 82,932 75,421Investment Income 68 100 1 2 50 74 43 64 663 2,163 60 89 35 52 74 110 13 19 47 185 1,054 2,858Grants and Contributions 882 882 0 0 0 11,117 8,636 0 0 0 0 1,735 1,382 13,734 10,900Other Revenue 0 0 0 0 619 2,256 0 0 0 0 0 619 2,256Total Revenue 2,544 2,286 5 5 2,061 1,746 1,857 1,613 68,118 63,378 10,581 9,576 2,969 2,595 8,322 8,571 51 53 1,831 1,612 98,339 91,435Gain/ (Loss) on Disposal ofNon Current Assets (532) 344 (532) 344NET COST OF SERVICES 73,116 65,441 1,191 2,116 62,806 54,884 43,371 40,665 274,691 252,656 47,800 48,003 38,497 32,263 63,138 63,108 11,365 8,042 20,605 14,887 636,580 582,065* The name and purpose of each program is summarised in Note 19.The preparation of each year’s Program Statement is based on statistical data for the previous year, together withany known program enhancements or definitional changes that have been advised by <strong>NSW</strong> <strong>Health</strong>.Using this methodology for <strong>2001</strong>/<strong>02</strong>, no material variations have occurred, with the movements largelyrepresenting the affects of cost escalation and specific enhancement funding.35


