2001-02 Annual Report - Sydney Local Health District - NSW ...
2001-02 Annual Report - Sydney Local Health District - NSW ...
2001-02 Annual Report - Sydney Local Health District - NSW ...

Create successful ePaper yourself
Turn your PDF publications into a flip-book with our unique Google optimized e-Paper software.
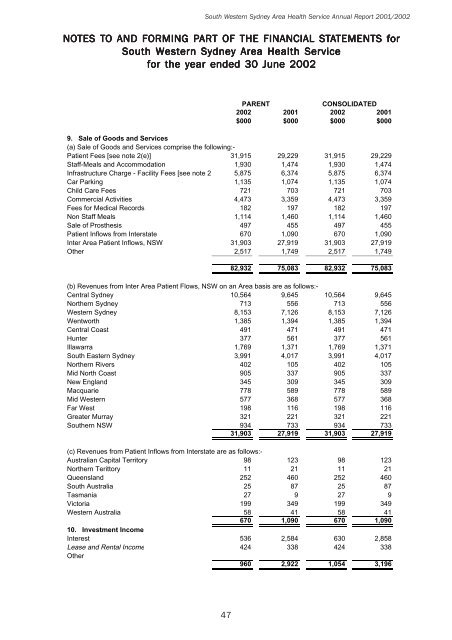
South Western <strong>Sydney</strong> Area <strong>Health</strong> Service <strong>Annual</strong> <strong>Report</strong> <strong>2001</strong>/20<strong>02</strong>NOTES TO AND FORMING PARART OF THE FINANCIAL STATEMENTS TEMENTS forSouth Western <strong>Sydney</strong> Area <strong>Health</strong> Servicefor the year ended 30 June 20<strong>02</strong>PARENTCONSOLIDATED20<strong>02</strong> <strong>2001</strong> 20<strong>02</strong> <strong>2001</strong>$000 $000 $000 $0009. Sale of Goods and Services(a) Sale of Goods and Services comprise the following:-Patient Fees [see note 2(e)] 31,915 29,229 31,915 29,229Staff-Meals and Accommodation 1,930 1,474 1,930 1,474Infrastructure Charge - Facility Fees [see note 2 5,875 6,374 5,875 6,374Car Parking 1,135 1,074 1,135 1,074Child Care Fees 721 703 721 703Commercial Activities 4,473 3,359 4,473 3,359Fees for Medical Records 182 197 182 197Non Staff Meals 1,114 1,460 1,114 1,460Sale of Prosthesis 497 455 497 455Patient Inflows from Interstate 670 1,090 670 1,090Inter Area Patient Inflows, <strong>NSW</strong> 31,903 27,919 31,903 27,919Other 2,517 1,749 2,517 1,74982,932 75,083 82,932 75,083(b) Revenues from Inter Area Patient Flows, <strong>NSW</strong> on an Area basis are as follows:-Central <strong>Sydney</strong> 10,564 9,645 10,564 9,645Northern <strong>Sydney</strong> 713 556 713 556Western <strong>Sydney</strong> 8,153 7,126 8,153 7,126Wentworth 1,385 1,394 1,385 1,394Central Coast 491 471 491 471Hunter 377 561 377 561Illawarra 1,769 1,371 1,769 1,371South Eastern <strong>Sydney</strong> 3,991 4,017 3,991 4,017Northern Rivers 4<strong>02</strong> 105 4<strong>02</strong> 105Mid North Coast 905 337 905 337New England 345 309 345 309Macquarie 778 589 778 589Mid Western 577 368 577 368Far West 198 116 198 116Greater Murray 321 221 321 221Southern <strong>NSW</strong> 934 733 934 73331,903 27,919 31,903 27,919(c) Revenues from Patient Inflows from Interstate are as follows:-Australian Capital Territory 98 123 98 123Northern Terittory 11 21 11 21Queensland 252 460 252 460South Australia 25 87 25 87Tasmania 27 9 27 9Victoria 199 349 199 349Western Australia 58 41 58 41670 1,090 670 1,09010. Investment IncomeInterest 536 2,584 630 2,858Lease and Rental Income 424 338 424 338Other960 2,922 1,054 3,19647