Cost and Effective Analysis of the LINKAGES ... - Linkages Project
Cost and Effective Analysis of the LINKAGES ... - Linkages Project
Cost and Effective Analysis of the LINKAGES ... - Linkages Project

You also want an ePaper? Increase the reach of your titles
YUMPU automatically turns print PDFs into web optimized ePapers that Google loves.
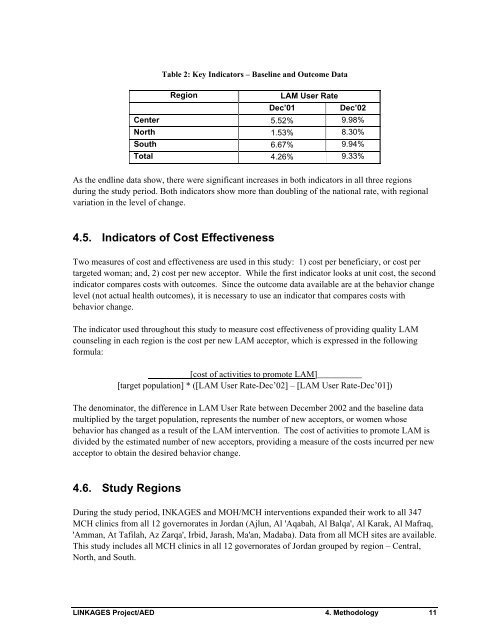
Table 2: Key Indicators – Baseline <strong>and</strong> Outcome DataRegionLAM User RateDec’01Dec’02Center 5.52% 9.98%North 1.53% 8.30%South 6.67% 9.94%Total 4.26% 9.33%As <strong>the</strong> endline data show, <strong>the</strong>re were significant increases in both indicators in all three regionsduring <strong>the</strong> study period. Both indicators show more than doubling <strong>of</strong> <strong>the</strong> national rate, with regionalvariation in <strong>the</strong> level <strong>of</strong> change.4.5. Indicators <strong>of</strong> <strong>Cost</strong> <strong>Effective</strong>nessTwo measures <strong>of</strong> cost <strong>and</strong> effectiveness are used in this study: 1) cost per beneficiary, or cost pertargeted woman; <strong>and</strong>, 2) cost per new acceptor. While <strong>the</strong> first indicator looks at unit cost, <strong>the</strong> secondindicator compares costs with outcomes. Since <strong>the</strong> outcome data available are at <strong>the</strong> behavior changelevel (not actual health outcomes), it is necessary to use an indicator that compares costs withbehavior change.The indicator used throughout this study to measure cost effectiveness <strong>of</strong> providing quality LAMcounseling in each region is <strong>the</strong> cost per new LAM acceptor, which is expressed in <strong>the</strong> followingformula:[cost <strong>of</strong> activities to promote LAM]__________[target population] * ([LAM User Rate-Dec’02] – [LAM User Rate-Dec’01])The denominator, <strong>the</strong> difference in LAM User Rate between December 2002 <strong>and</strong> <strong>the</strong> baseline datamultiplied by <strong>the</strong> target population, represents <strong>the</strong> number <strong>of</strong> new acceptors, or women whosebehavior has changed as a result <strong>of</strong> <strong>the</strong> LAM intervention. The cost <strong>of</strong> activities to promote LAM isdivided by <strong>the</strong> estimated number <strong>of</strong> new acceptors, providing a measure <strong>of</strong> <strong>the</strong> costs incurred per newacceptor to obtain <strong>the</strong> desired behavior change.4.6. Study RegionsDuring <strong>the</strong> study period, INKAGES <strong>and</strong> MOH/MCH interventions exp<strong>and</strong>ed <strong>the</strong>ir work to all 347MCH clinics from all 12 governorates in Jordan (Ajlun, Al 'Aqabah, Al Balqa', Al Karak, Al Mafraq,'Amman, At Tafilah, Az Zarqa', Irbid, Jarash, Ma'an, Madaba). Data from all MCH sites are available.This study includes all MCH clinics in all 12 governorates <strong>of</strong> Jordan grouped by region – Central,North, <strong>and</strong> South.<strong>LINKAGES</strong> <strong>Project</strong>/AED 4. Methodology 11