Cost and Effective Analysis of the LINKAGES ... - Linkages Project
Cost and Effective Analysis of the LINKAGES ... - Linkages Project
Cost and Effective Analysis of the LINKAGES ... - Linkages Project

You also want an ePaper? Increase the reach of your titles
YUMPU automatically turns print PDFs into web optimized ePapers that Google loves.
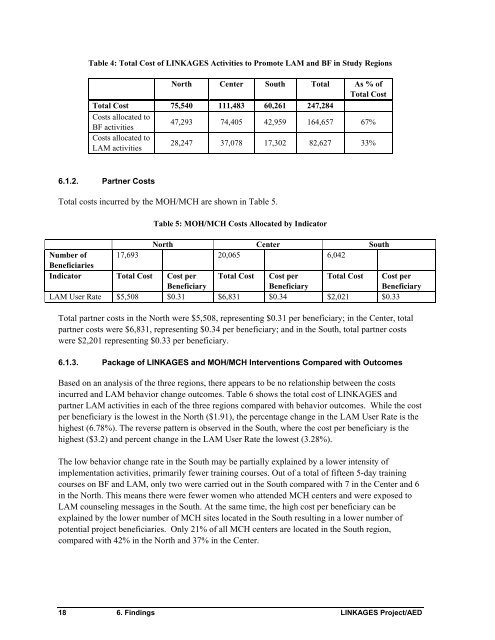
Table 4: Total <strong>Cost</strong> <strong>of</strong> <strong>LINKAGES</strong> Activities to Promote LAM <strong>and</strong> BF in Study RegionsNorth Center South Total As % <strong>of</strong>Total <strong>Cost</strong>Total <strong>Cost</strong> 75,540 111,483 60,261 247,284<strong>Cost</strong>s allocated toBF activities47,293 74,405 42,959 164,657 67%<strong>Cost</strong>s allocated toLAM activities28,247 37,078 17,302 82,627 33%6.1.2. Partner <strong>Cost</strong>sTotal costs incurred by <strong>the</strong> MOH/MCH are shown in Table 5.Table 5: MOH/MCH <strong>Cost</strong>s Allocated by IndicatorNorth Center SouthNumber <strong>of</strong> 17,693 20,065 6,042BeneficiariesIndicator Total <strong>Cost</strong> <strong>Cost</strong> perBeneficiaryTotal <strong>Cost</strong> <strong>Cost</strong> perBeneficiaryTotal <strong>Cost</strong> <strong>Cost</strong> perBeneficiaryLAM User Rate $5,508 $0.31 $6,831 $0.34 $2,021 $0.33Total partner costs in <strong>the</strong> North were $5,508, representing $0.31 per beneficiary; in <strong>the</strong> Center, totalpartner costs were $6,831, representing $0.34 per beneficiary; <strong>and</strong> in <strong>the</strong> South, total partner costswere $2,201 representing $0.33 per beneficiary.6.1.3. Package <strong>of</strong> <strong>LINKAGES</strong> <strong>and</strong> MOH/MCH Interventions Compared with OutcomesBased on an analysis <strong>of</strong> <strong>the</strong> three regions, <strong>the</strong>re appears to be no relationship between <strong>the</strong> costsincurred <strong>and</strong> LAM behavior change outcomes. Table 6 shows <strong>the</strong> total cost <strong>of</strong> <strong>LINKAGES</strong> <strong>and</strong>partner LAM activities in each <strong>of</strong> <strong>the</strong> three regions compared with behavior outcomes. While <strong>the</strong> costper beneficiary is <strong>the</strong> lowest in <strong>the</strong> North ($1.91), <strong>the</strong> percentage change in <strong>the</strong> LAM User Rate is <strong>the</strong>highest (6.78%). The reverse pattern is observed in <strong>the</strong> South, where <strong>the</strong> cost per beneficiary is <strong>the</strong>highest ($3.2) <strong>and</strong> percent change in <strong>the</strong> LAM User Rate <strong>the</strong> lowest (3.28%).The low behavior change rate in <strong>the</strong> South may be partially explained by a lower intensity <strong>of</strong>implementation activities, primarily fewer training courses. Out <strong>of</strong> a total <strong>of</strong> fifteen 5-day trainingcourses on BF <strong>and</strong> LAM, only two were carried out in <strong>the</strong> South compared with 7 in <strong>the</strong> Center <strong>and</strong> 6in <strong>the</strong> North. This means <strong>the</strong>re were fewer women who attended MCH centers <strong>and</strong> were exposed toLAM counseling messages in <strong>the</strong> South. At <strong>the</strong> same time, <strong>the</strong> high cost per beneficiary can beexplained by <strong>the</strong> lower number <strong>of</strong> MCH sites located in <strong>the</strong> South resulting in a lower number <strong>of</strong>potential project beneficiaries. Only 21% <strong>of</strong> all MCH centers are located in <strong>the</strong> South region,compared with 42% in <strong>the</strong> North <strong>and</strong> 37% in <strong>the</strong> Center.18 6. Findings <strong>LINKAGES</strong> <strong>Project</strong>/AED