Cost and Effective Analysis of the LINKAGES ... - Linkages Project
Cost and Effective Analysis of the LINKAGES ... - Linkages Project
Cost and Effective Analysis of the LINKAGES ... - Linkages Project

You also want an ePaper? Increase the reach of your titles
YUMPU automatically turns print PDFs into web optimized ePapers that Google loves.
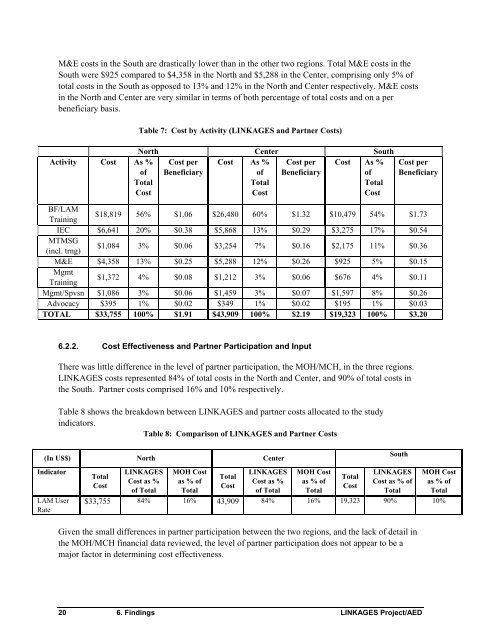
M&E costs in <strong>the</strong> South are drastically lower than in <strong>the</strong> o<strong>the</strong>r two regions. Total M&E costs in <strong>the</strong>South were $925 compared to $4,358 in <strong>the</strong> North <strong>and</strong> $5,288 in <strong>the</strong> Center, comprising only 5% <strong>of</strong>total costs in <strong>the</strong> South as opposed to 13% <strong>and</strong> 12% in <strong>the</strong> North <strong>and</strong> Center respectively. M&E costsin <strong>the</strong> North <strong>and</strong> Center are very similar in terms <strong>of</strong> both percentage <strong>of</strong> total costs <strong>and</strong> on a perbeneficiary basis.Activity <strong>Cost</strong> As %<strong>of</strong>Total<strong>Cost</strong>Table 7: <strong>Cost</strong> by Activity (<strong>LINKAGES</strong> <strong>and</strong> Partner <strong>Cost</strong>s)North Center South<strong>Cost</strong> per<strong>Cost</strong> perBeneficiaryBeneficiary<strong>Cost</strong> As %<strong>of</strong>Total<strong>Cost</strong><strong>Cost</strong> As %<strong>of</strong>Total<strong>Cost</strong><strong>Cost</strong> perBeneficiaryBF/LAMTraining$18,819 56% $1.06 $26,480 60% $1.32 $10,479 54% $1.73IEC $6,641 20% $0.38 $5,868 13% $0.29 $3,275 17% $0.54MTMSG(incl. trng)$1,084 3% $0.06 $3,254 7% $0.16 $2,175 11% $0.36M&E $4,358 13% $0.25 $5,288 12% $0.26 $925 5% $0.15MgmtTraining$1,372 4% $0.08 $1,212 3% $0.06 $676 4% $0.11Mgmt/Spvsn $1,086 3% $0.06 $1,459 3% $0.07 $1,597 8% $0.26Advocacy $395 1% $0.02 $349 1% $0.02 $195 1% $0.03TOTAL $33,755 100% $1.91 $43,909 100% $2.19 $19,323 100% $3.206.2.2. <strong>Cost</strong> <strong>Effective</strong>ness <strong>and</strong> Partner Participation <strong>and</strong> InputThere was little difference in <strong>the</strong> level <strong>of</strong> partner participation, <strong>the</strong> MOH/MCH, in <strong>the</strong> three regions.<strong>LINKAGES</strong> costs represented 84% <strong>of</strong> total costs in <strong>the</strong> North <strong>and</strong> Center, <strong>and</strong> 90% <strong>of</strong> total costs in<strong>the</strong> South. Partner costs comprised 16% <strong>and</strong> 10% respectively.Table 8 shows <strong>the</strong> breakdown between <strong>LINKAGES</strong> <strong>and</strong> partner costs allocated to <strong>the</strong> studyindicators.Table 8: Comparison <strong>of</strong> <strong>LINKAGES</strong> <strong>and</strong> Partner <strong>Cost</strong>s(In US$) North CenterSouthIndicatorLAM UserRate<strong>LINKAGES</strong> MOH <strong>Cost</strong><strong>LINKAGES</strong> MOH <strong>Cost</strong><strong>LINKAGES</strong> MOH <strong>Cost</strong>TotalTotalTotal<strong>Cost</strong> as % as % <strong>of</strong><strong>Cost</strong> as % as % <strong>of</strong><strong>Cost</strong> as % <strong>of</strong> as % <strong>of</strong><strong>Cost</strong><strong>Cost</strong><strong>Cost</strong><strong>of</strong> Total Total<strong>of</strong> Total TotalTotal Total$33,755 84% 16% 43,909 84% 16% 19,323 90% 10%Given <strong>the</strong> small differences in partner participation between <strong>the</strong> two regions, <strong>and</strong> <strong>the</strong> lack <strong>of</strong> detail in<strong>the</strong> MOH/MCH financial data reviewed, <strong>the</strong> level <strong>of</strong> partner participation does not appear to be amajor factor in determining cost effectiveness.20 6. Findings <strong>LINKAGES</strong> <strong>Project</strong>/AED