CYCLE NETWORK AND ROUTE PLANNING GUIDE
CYCLE NETWORK AND ROUTE PLANNING GUIDE
CYCLE NETWORK AND ROUTE PLANNING GUIDE

You also want an ePaper? Increase the reach of your titles
YUMPU automatically turns print PDFs into web optimized ePapers that Google loves.
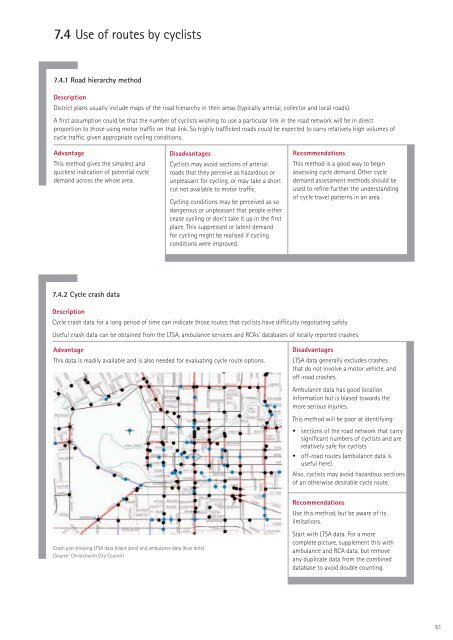
7.4 Use of routes by cyclists7.4.1 Road hierarchy methodDescriptionDistrict plans usually include maps of the road hierarchy in their areas (typically arterial, collector and local roads).A first assumption could be that the number of cyclists wishing to use a particular link in the road network will be in directproportion to those using motor traffic on that link. So highly trafficked roads could be expected to carry relatively high volumes ofcycle traffic, given appropriate cycling conditions.AdvantageThis method gives the simplest andquickest indication of potential cycledemand across the whole area.DisadvantagesCyclists may avoid sections of arterialroads that they perceive as hazardous orunpleasant for cycling, or may take a shortcut not available to motor traffic.Cycling conditions may be perceived as sodangerous or unpleasant that people eithercease cycling or don’t take it up in the firstplace. This suppressed or latent demandfor cycling might be realised if cyclingconditions were improved.RecommendationsThis method is a good way to beginassessing cycle demand. Other cycledemand assessment methods should beused to refine further the understandingof cycle travel patterns in an area.7.4.2 Cycle crash dataDescriptionCycle crash data for a long period of time can indicate those routes that cyclists have difficulty negotiating safely.Useful crash data can be obtained from the LTSA, ambulance services and RCAs’ databases of locally reported crashes.AdvantageThis data is readily available and is also needed for evaluating cycle route options.DisadvantagesLTSA data generally excludes crashesthat do not involve a motor vehicle, andoff-road crashes.Ambulance data has good locationinformation but is biased towards themore serious injuries.This method will be poor at identifying:• sections of the road network that carrysignificant numbers of cyclists and arerelatively safe for cyclists• off-road routes (ambulance data isuseful here).Also, cyclists may avoid hazardous sectionsof an otherwise desirable cycle route.Crash plot showing LTSA data (black dots) and ambulance data (blue dots)(Source: Christchurch City Council)RecommendationsUse this method, but be aware of itslimitations.Start with LTSA data. For a morecomplete picture, supplement this withambulance and RCA data, but removeany duplicate data from the combineddatabase to avoid double counting.51