CYCLE NETWORK AND ROUTE PLANNING GUIDE
CYCLE NETWORK AND ROUTE PLANNING GUIDE
CYCLE NETWORK AND ROUTE PLANNING GUIDE
You also want an ePaper? Increase the reach of your titles
YUMPU automatically turns print PDFs into web optimized ePapers that Google loves.
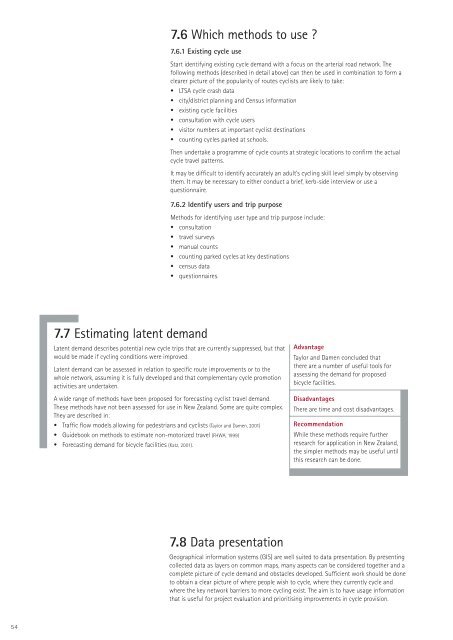
7.6 Which methods to use ?7.6.1 Existing cycle useStart identifying existing cycle demand with a focus on the arterial road network. Thefollowing methods (described in detail above) can then be used in combination to form aclearer picture of the popularity of routes cyclists are likely to take:• LTSA cycle crash data• city/district planning and Census information• existing cycle facilities• consultation with cycle users• visitor numbers at important cyclist destinations• counting cycles parked at schools.Then undertake a programme of cycle counts at strategic locations to confirm the actualcycle travel patterns.It may be difficult to identify accurately an adult’s cycling skill level simply by observingthem. It may be necessary to either conduct a brief, kerb-side interview or use aquestionnaire.7.6.2 Identify users and trip purposeMethods for identifying user type and trip purpose include:• consultation• travel surveys• manual counts• counting parked cycles at key destinations• census data• questionnaires.7.7 Estimating latent demandLatent demand describes potential new cycle trips that are currently suppressed, but thatwould be made if cycling conditions were improved.Latent demand can be assessed in relation to specific route improvements or to thewhole network, assuming it is fully developed and that complementary cycle promotionactivities are undertaken.A wide range of methods have been proposed for forecasting cyclist travel demand.These methods have not been assessed for use in New Zealand. Some are quite complex.They are described in:• Traffic flow models allowing for pedestrians and cyclists (Taylor and Damen, 2001)• Guidebook on methods to estimate non-motorized travel (FHWA, 1999)• Forecasting demand for bicycle facilities (Katz, 2001).AdvantageTaylor and Damen concluded thatthere are a number of useful tools forassessing the demand for proposedbicycle facilities.DisadvantagesThere are time and cost disadvantages.RecommendationWhile these methods require furtherresearch for application in New Zealand,the simpler methods may be useful untilthis research can be done.7.8 Data presentationGeographical information systems (GIS) are well suited to data presentation. By presentingcollected data as layers on common maps, many aspects can be considered together and acomplete picture of cycle demand and obstacles developed. Sufficient work should be doneto obtain a clear picture of where people wish to cycle, where they currently cycle andwhere the key network barriers to more cycling exist. The aim is to have usage informationthat is useful for project evaluation and prioritising improvements in cycle provision.54


