Sexual and Relationship Therapy Is responsive sexual desire for ...
Sexual and Relationship Therapy Is responsive sexual desire for ...
Sexual and Relationship Therapy Is responsive sexual desire for ...

You also want an ePaper? Increase the reach of your titles
YUMPU automatically turns print PDFs into web optimized ePapers that Google loves.
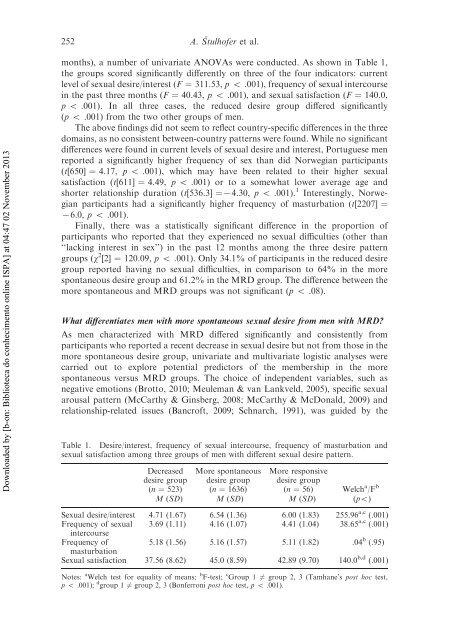
252A. Sˇtulhofer et al.Downloaded by [b-on: Biblioteca do conhecimento online ISPA] at 04:47 02 November 2013months), a number of univariate ANOVAs were conducted. As shown in Table 1,the groups scored significantly differently on three of the four indicators: currentlevel of <strong>sexual</strong> <strong>desire</strong>/interest (F ¼ 311.53, p 5 .001), frequency of <strong>sexual</strong> intercoursein the past three months (F ¼ 40.43, p 5 .001), <strong>and</strong> <strong>sexual</strong> satisfaction (F ¼ 140.0,p 5 .001). In all three cases, the reduced <strong>desire</strong> group differed significantly(p 5 .001) from the two other groups of men.The above findings did not seem to reflect country-specific differences in the threedomains, as no consistent between-country patterns were found. While no significantdifferences were found in current levels of <strong>sexual</strong> <strong>desire</strong> <strong>and</strong> interest, Portuguese menreported a significantly higher frequency of sex than did Norwegian participants(t[650] ¼ 4.17, p 5 .001), which may have been related to their higher <strong>sexual</strong>satisfaction (t[611] ¼ 4.49, p 5 .001) or to a somewhat lower average age <strong>and</strong>shorter relationship duration (t[536.3] ¼74.30, p 5 .001). 1 Interestingly, Norwegianparticipants had a significantly higher frequency of masturbation (t[2207] ¼76.0, p 5 .001).Finally, there was a statistically significant difference in the proportion ofparticipants who reported that they experienced no <strong>sexual</strong> difficulties (other than‘‘lacking interest in sex’’) in the past 12 months among the three <strong>desire</strong> patterngroups (w 2 [2] ¼ 120.09, p 5 .001). Only 34.1% of participants in the reduced <strong>desire</strong>group reported having no <strong>sexual</strong> difficulties, in comparison to 64% in the morespontaneous <strong>desire</strong> group <strong>and</strong> 61.2% in the MRD group. The difference between themore spontaneous <strong>and</strong> MRD groups was not significant (p 5 .08).What differentiates men with more spontaneous <strong>sexual</strong> <strong>desire</strong> from men with MRD?As men characterized with MRD differed significantly <strong>and</strong> consistently fromparticipants who reported a recent decrease in <strong>sexual</strong> <strong>desire</strong> but not from those in themore spontaneous <strong>desire</strong> group, univariate <strong>and</strong> multivariate logistic analyses werecarried out to explore potential predictors of the membership in the morespontaneous versus MRD groups. The choice of independent variables, such asnegative emotions (Brotto, 2010; Meuleman & van Lankveld, 2005), specific <strong>sexual</strong>arousal pattern (McCarthy & Ginsberg, 2008; McCarthy & McDonald, 2009) <strong>and</strong>relationship-related issues (Bancroft, 2009; Schnarch, 1991), was guided by theTable 1. Desire/interest, frequency of <strong>sexual</strong> intercourse, frequency of masturbation <strong>and</strong><strong>sexual</strong> satisfaction among three groups of men with different <strong>sexual</strong> <strong>desire</strong> pattern.Decreased<strong>desire</strong> group(n ¼ 523)More spontaneous<strong>desire</strong> group(n ¼ 1636)More <strong>responsive</strong><strong>desire</strong> group(n ¼ 56) Welch a /F bM (SD) M (SD) M (SD) (p5)<strong>Sexual</strong> <strong>desire</strong>/interest 4.71 (1.67) 6.54 (1.36) 6.00 (1.83) 255.96 a,c (.001)Frequency of <strong>sexual</strong> 3.69 (1.11) 4.16 (1.07) 4.41 (1.04) 38.65 a,c (.001)intercourseFrequency of 5.18 (1.56) 5.16 (1.57) 5.11 (1.82) .04 b (.95)masturbation<strong>Sexual</strong> satisfaction 37.56 (8.62) 45.0 (8.59) 42.89 (9.70) 140.0 b,d (.001)Notes: a Welch test <strong>for</strong> equality of means; b F-test; c Group 1 6¼ group 2, 3 (Tamhane’s post hoc test,p 5 .001); d group 1 6¼ group 2, 3 (Bonferroni post hoc test, p 5 .001).