Electronic Excitations in Solid and Liquid He-4 - Advanced Photon ...
Electronic Excitations in Solid and Liquid He-4 - Advanced Photon ...
Electronic Excitations in Solid and Liquid He-4 - Advanced Photon ...

Create successful ePaper yourself
Turn your PDF publications into a flip-book with our unique Google optimized e-Paper software.
<strong>Electronic</strong> <strong>Excitations</strong> <strong>in</strong> <strong>Solid</strong> <strong>and</strong> <strong>Liquid</strong> <strong>He</strong>-4<br />
D. A. Arms, 1 M. Schwoerer-Böhn<strong>in</strong>g, 2 R. O. Simmons, 1 A.T. Macr<strong>and</strong>er, 3 T. J. Graber 4<br />
1 Frederick Seitz Materials Research Laboratory <strong>and</strong> Department of Physics,<br />
University of Ill<strong>in</strong>ois at Urbana-Champaign, Urbana, IL, U.S.A.<br />
2 HP-CAT, <strong>Advanced</strong> <strong>Photon</strong> Source, Argonne National Laboratory, Argonne, IL, U.S.A.<br />
3 <strong>Advanced</strong> <strong>Photon</strong> Source, Argonne National Laboratory, Argonne, IL, U.S.A.<br />
4 Consortium for <strong>Advanced</strong> Radiation Sources, University of Chicago, Chicago, IL, U.S.A.<br />
Introduction<br />
There have been few exciton measurements made for helium,<br />
all of which are for 4 <strong>He</strong>. The measurements have been of svp<br />
(saturated vapor pressure) liquid at 1.2K us<strong>in</strong>g EUV reflectance<br />
measurements, 1 clusters of sizes up to N=5000 us<strong>in</strong>g fluorescence<br />
measurements, 2 , 3 <strong>and</strong> 13.5 cm 3 /mole solid hcp 4 <strong>He</strong> us<strong>in</strong>g <strong>in</strong>elastic<br />
x-ray scatter<strong>in</strong>g, 4 This experiment was done to take better resolution<br />
measurements of helium excitons, to look for dispersion <strong>in</strong><br />
the hcp solid <strong>and</strong> density scal<strong>in</strong>g <strong>in</strong> the liquid.<br />
Methods <strong>and</strong> Materials<br />
This <strong>in</strong>elastic x-ray scatter<strong>in</strong>g experiment was conducted at<br />
ChemMatCARS on the 15-ID beaml<strong>in</strong>e. The energy of the monochromator<br />
was set to 9.8865 keV, with a measured b<strong>and</strong>pass of<br />
1.1 eV FWHM. The analyzer used was a spherically bent silicon<br />
crystal employ<strong>in</strong>g the (555) reflection.<br />
<strong>He</strong>lium crystals form only under applied pressure, even at the<br />
lowest temperature. Our setup (previously described by<br />
Venkataraman <strong>and</strong> Simmons 5 ) <strong>in</strong>volves a gas-h<strong>and</strong>l<strong>in</strong>g system<br />
able to provide 210 MPa of pressure, <strong>and</strong> a cryostat able to go<br />
down to 10K. The helium samples were conta<strong>in</strong>ed <strong>in</strong> a cyl<strong>in</strong>drical<br />
beryllium sample cell (0.8 mm ID). Empty cell measurements<br />
at 25.0K were taken at the same orientation as the data measurements<br />
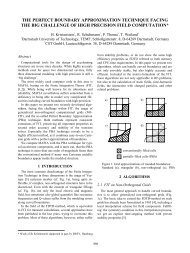
at the end of the run. A prelim<strong>in</strong>ary empty-cell measurement<br />
with a short count time is shown <strong>in</strong> Fig. 1, along with a data<br />
FIG. 1. These are prelim<strong>in</strong>ary scans of empty-cell background <strong>and</strong> data,<br />
show<strong>in</strong>g the full range of the background due to beryllium excitations.<br />
The data had 30 s/po<strong>in</strong>t, while the background had 40 s/pt.<br />
scan, show<strong>in</strong>g the reproducibility of the beryllium excitations at<br />
energies lower than the helium exciton.<br />
Three 4 <strong>He</strong> samples were studied: an hcp crystal at 14.0K with<br />
a molar volume of 10.72 cm 3 /mole <strong>and</strong> two liquid samples at 25.0<br />
1<br />
K with molar volumes of 11.22 cm 3 /mole (liquid A) <strong>and</strong> 12.27<br />
cm3/mole (liquid B). The hcp crystal had a c lattice parameter of<br />
4.782 Å, taken from the molar volume found from comparison of<br />
its measured melt<strong>in</strong>g po<strong>in</strong>t to previous melt<strong>in</strong>g curve studies. 6 , 7<br />
Three measurements were done for the crystal at different po<strong>in</strong>ts<br />
<strong>in</strong> reciprocal space, near the (002) reflection along the c-axis.<br />
Results<br />
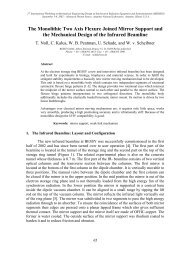
To extract the helium signal, the normalized empty-cell scans<br />
were directly subtracted from the normalized data scans without<br />
any scal<strong>in</strong>g. Fig. 2 shows the data <strong>and</strong> empty-cell normalized<br />
FIG. 2. These are the data <strong>and</strong> empty-cell normalized scans for 12.27<br />
cm 3 /mole liquid. The data scan was taken with 240 s/pt, while the background<br />
scan was taken with 300 s/pt.<br />
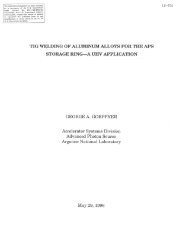
FIG. 3. This is the 30.0° measurement for the hcp crystal. A Gaussian<br />
plus a l<strong>in</strong>ear function has been fit to the data, giv<strong>in</strong>g the exciton energy<br />
as the position of the Gaussian.
Table 1.<br />
Sample 2θ (º) Q (Å -1 ) Q *<br />
Exciton<br />
± 1.5 ± 0.13 (2π/c) Energy (eV)<br />
crystal 22.0 1.91 1.5 23.24<br />
crystal 30.0 2.59 2.0 22.60<br />
crystal 35.0 3.01 2.3 23.02<br />
liquid A 30.0 2.59 22.60<br />
liquid B 30.0 2.59 22.41<br />
scans for liquid B. The empty cell subtracted data are fitted to a<br />
Gaussian plus a l<strong>in</strong>ear function. An example of this is <strong>in</strong> Fig. 3,<br />
which is the 30.0º crystal data. The Gaussian position is the energy<br />
of the exciton. The summary of results are <strong>in</strong> Table 1, where<br />
Q is the momentum transfer of the photons, <strong>and</strong> Q * is the reduced<br />
momentum transfer <strong>in</strong> terms of the c-axis. The uncerta<strong>in</strong>ty of 2θ<br />
is ± 1.5º, while for Q it is ± 0.13 Å -1 .<br />
Discussion<br />
The three crystal measurements can be represented as along<br />
the c-axis of the third periodic zone at -1.0A, Γ, <strong>and</strong> 0.6A. The<br />
correspond<strong>in</strong>g measured excitons exhibit dispersion with a m<strong>in</strong>imum<br />
at the zone center Γ. The data support a calculated value of<br />
31.0 eV for an <strong>in</strong>terb<strong>and</strong> transition across the m<strong>in</strong>imum b<strong>and</strong>gap<br />
which occurs at Γ. The liquid measurements show a shift to higher<br />
energy for the exciton as the density is <strong>in</strong>creased.<br />
2<br />
Acknowledgments<br />
Use of the <strong>Advanced</strong> <strong>Photon</strong> Source was supported by the<br />
U.S. Department of Energy, Office of Science, Office of Basic<br />
Energy Sciences, under Contract No. W-31-109-ENG-38. Use of<br />
the ChemMatCARS beaml<strong>in</strong>e (sector 15) was supported by the<br />
NSF/DOE under Grant No. CHE-952232. Work supported by<br />
U.S. Department of Energy, Division of Materials Sciences, under<br />
contract DOE-DE-FG02-96ER45439.<br />
References<br />
1 C.M. Surko, G.J. Dick, F. Reif, <strong>and</strong> W.C. Walker, Phys. Rev.<br />
Lett. 23, 842-846 (1969).<br />
2 M. Joppien, R. Karnbach, <strong>and</strong> T. Möller, Phys. Rev. Lett. 71,<br />
2654-2657 (1993).<br />
3 M. Joppien, Ph.D. thesis, Universität Hamburg, 1994.<br />
4 N. Schell, R.O. Simmons, A. Kaprolat, W. Schülke, <strong>and</strong> E.<br />
Burkel, Phys. Rev. Lett. 74, 2535 (1995).<br />
5 C.T. Venkataraman <strong>and</strong> R.O. Simmons, Rev. Sci. Instr. 67, 9 +<br />
CD-ROM (1996).<br />
6 R.L. Mills <strong>and</strong> E.R. Grilly, Phys. Rev. 99, 480-486 (1955).<br />
7<br />
E.R. Grilly <strong>and</strong> R.L. Mills, Ann. Phys. (N.Y.) 8, 1-23 (1959).