Visualize and interpret the geometry, heterogeneity and lateral ...
Visualize and interpret the geometry, heterogeneity and lateral ...
Visualize and interpret the geometry, heterogeneity and lateral ...

Create successful ePaper yourself
Turn your PDF publications into a flip-book with our unique Google optimized e-Paper software.
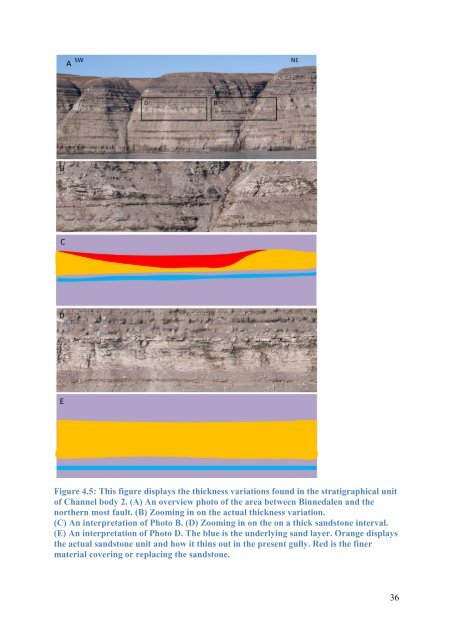
Figure 4.5: This figure displays <strong>the</strong> thickness variations found in <strong>the</strong> stratigraphical unitof Channel body 2. (A) An overview photo of <strong>the</strong> area between Binnedalen <strong>and</strong> <strong>the</strong>nor<strong>the</strong>rn most fault. (B) Zooming in on <strong>the</strong> actual thickness variation.(C) An <strong>interpret</strong>ation of Photo B. (D) Zooming in on <strong>the</strong> on a thick s<strong>and</strong>stone interval.(E) An <strong>interpret</strong>ation of Photo D. The blue is <strong>the</strong> underlying s<strong>and</strong> layer. Orange displays<strong>the</strong> actual s<strong>and</strong>stone unit <strong>and</strong> how it thins out in <strong>the</strong> present gully. Red is <strong>the</strong> finermaterial covering or replacing <strong>the</strong> s<strong>and</strong>stone.36