RESERVOIR SEDIMENTATION ASSESSMENT GUIDELINE - Aneel
RESERVOIR SEDIMENTATION ASSESSMENT GUIDELINE - Aneel
RESERVOIR SEDIMENTATION ASSESSMENT GUIDELINE - Aneel

Create successful ePaper yourself
Turn your PDF publications into a flip-book with our unique Google optimized e-Paper software.
BRAZILIAN ELECTRICITY REGULATORY AGENCY - ANEELHydrological Studies and Information Department - SIH<strong>RESERVOIR</strong> <strong>SEDIMENTATION</strong><strong>ASSESSMENT</strong> <strong>GUIDELINE</strong>Newton de Oliveira CarvalhoNaziano Pantoja Filizola JúniorPaulo Marcos Coutinho dos SantosJorge Enoch Furquim Werneck LimaBrasilia, DF – 2000
Reservoir Sedimentation Assessment GuidelineSUMMARY<strong>RESERVOIR</strong> <strong>SEDIMENTATION</strong><strong>ASSESSMENT</strong> <strong>GUIDELINE</strong>1. Introduction.................................................................................................. 52. Reservoirs with sedimentation problems in Brazil...................................... 73. Deposition of sediments in reservoirs….............……….……………........ 74. The relevance of the sedimentation assessment survey for hydropowerplants ……....................………………………………………………....... 94.1 Inventory stage ……….................................……………………........104.2 Feasibility and basic project stages …… ......................................……104.3 Operational stage ..............……..........................……………….......... 115. Factors affecting sediments yield ……............………............................... 146. Reservoir sedimentation assessment …………................................................... 126.1 Reservoir data ............................................................…….............. 137. Sediment production determination...........................................…………......... 137.1 Erosion assessment....................................................................…....... 157.2 Sedimentometric gaging stations networking……..................…......... 157.3 Gaging station installation and measurement frequency …….............. 167.4 Measurement methods......................................................................... 177.4.1 Sediment sampling………................................................... 237.4.2 Laboratory analysis...............................................…........... 257.4.3 Sediment discharge computation............................................ 277.5 Data Analysis …………..................................................................... 307.5.1 Continuous, hourly and daily measurements.............…......... 317.5.2 Eventual measurements.....................................………......... 327.5.3 Data regionalization.............................................……......... 368. Reservoirs Trapping Efficiency ………………………...................................... 388.1 Medium and large reservoirs cases ……............................................ 388.2 Small reservoirs case …...............................………........................... 399. Specific weight of deposits.............................................……………………... 429.1 Computed ............................................................................................ 429.2 Measured .............................................................................................. 449.3 Estimate .............................................................................................. 44ANEEL – Brazilian Electricity Regulatory Agency / SIH – Hydrologic Studies and Information Department2
Reservoir Sedimentation Assessment Guideline10. Estimation of sediment deposit in reservoirs..................................................... 4510.1 Sedimentation assessment methods ……............................................ 4510.2 Assessment of storage loss ......….….....………………………........ 4610.3 Assessment of reservoir useful life …............................................... 4710.4 Sediments distribution in reservoirs.................................................. 4810.5 Assessment of erosion rates….......................................................... 4811. Measurement of reservoirs sedimentation...............................………….......... 5111.1 Purpose of the survey.......................................................................... 5111.2 Survey frequency…............................................................................. 5211.3 Survey methods................................................................................... 5311.3.1 Contour survey ……………….................................…........ 5311.3.2 Topo-bathymetric survey ..................................................... 5411.4 Survey specifications........................................................................... 5911.5 Bed mapping ....................................................….............………...... 6111.6 Computation of reservoir volumes..............................................................6211.7 Computation of settled sediments volume ..........................………… 6911.8 Outline of new level x area x volume relations.................….............. 6611.9 Pivot point ................................................…………………….......... 6611.10 Bed scanning and geophysics……................................................... 6712. Control of a reservoir sedimentation................................................................. 6812.1 Preventive control............................................................................ 6912.2 Corrective practices ............................................................…............. 7012.2.1 Dredged sediments discharge …….......................………… 7013 Secondary effects due to sediments..........................................................…... 7113.1 Effects on the reservoir backwater .................................................... 7213.2 Changes on water quality..................................................................... 7313.3 Ecological effects ............................................................................... 7313.4 Erosion on reservoirs banks...................…..........................…............ 7413.5 Deposit erosion.....................................................................................7413.6 Downstream effects...................................…………..............…......... 7413.6.1 Channel degradation ....................................................…..... 7513.6.2 Main discharge .........................................…….................... 7713.6.3 Channel hydraulic features…......................................…….. 7713.6.4 Method of degradation constrained by the shield ...………. 7713.6.5 Method of degradation constrained by steady slope....……. 8113.7 Reservoir surveys supported by satellite imagery..............….............. 8413.8 Erosion control at the downstream channel...................………......... 85Bibliography (consulted and complementary) ........................................................ 86Glossary of terms, symbols and units ...........................................…….................. 93ANEEL – Brazilian Electricity Regulatory Agency / SIH – Hydrologic Studies and Information Department3
Reservoir Sedimentation Assessment Guideline1. INTRODUCTIONThe construction of a dam and the creation of an impounded river reach area usuallychange the stream natural conditions. Concerning the sedimentological aspect, the damscause a reduction on the flow velocity, thus causing the gradual deposition of thosesediments carried by the stream resulting in the sedimentation, gradually diminishingthe reservoir storage capacity. Therefore, it may come to hinder the reservoir operation,besides causing several kinds of environmental problems.Environmental and economic damages arising out of the sediments deposition inreservoirs may be hard to solve, especially in arid and semi-arid regions (ICOLD,1989). Apart of the reservoir size, this Guide seeks to deal with the problem in a simpleand objective way, presenting the critical conditions that may happen.Surely, the reservoir may undergo an undesired sedimentation, thus requiring studieseach case. Small lakes are more susceptible to quick sedimentation, what may happeneven in a single flood (Carvalho/Guilhon/Trindade, 2000). On the other hand, largereservoirs require more time to become sedimented. In Brazil, one can mention thereservoirs of Itaipu, Itá, Sobradinho and Tucuruí, where the total time of sedimentationassessed for each reservoir may overpass 1000 years. However, in a shorter period oftime – 20 to 30 years – the deposits at the backwater region - delta area - may be alreadyjeopardizing activities such as navigation. Furthermore, thin deposits at the banks maygive rising to suitable conditions for the growing of macrophytes plants that will surelybe displaced for areas nearby the dam and enter into the ducts, thus prejudicing powerproduction.A tributary to the reservoir that is flowing nearby the dam, or its facilities, mayaffect electric power production or other activities in a time shorter than the foreseen.Sedimentation cases are becoming intensified due to the increase of erosion at waterbasins. Therefore, it would be prudent to carry out sedimentological surveys for allprojects that require reservoir. In any case, the assessment carried out during theplanning stage shall be reviewed by a sedimentometric survey, including the operationof gaging station and topo-bathymetric survey. Those studies shall be simultaneouslywith environmental surveys.Sedimentation processes may be complex. The sediments carried through the fluvialsystem are primarily settled due to the lowering in the reservoir water speed. Assediments are accumulated in the lake, its water storage capacity is reduced. While acontinuous deposition takes place, there is a distribution of sediments at the reservoirs.The kind of distribution is influenced by both operation and occurrence of floods, whichare responsible for the transportation of great amount of sediments. When depositsaffect the reservoir useful life, it is necessary to change the reservoir operation or adoptany other corrective measure (ICOLD, 1989). Other effects may happen such as, forexample, the delta area becomes more susceptible to problems with floods; downstream,the river flume suffers erosion due to the absence of sediments at the runoff, and due tofloods attenuation and stream regularization as well.ANEEL – Brazilian Electricity Regulatory Agency / SIH – Hydrologic Studies and Information Department4
Reservoir Sedimentation Assessment GuidelineThis Guide aims at defining and studying those features directly related toplanning and project of new dams, as well as to the operation of the existing ones, bysurveying the production of sediments, the reservoir sedimentation, the sediment controland its secondary effects. Issues of that nature have not, up to this moment, been dulymanaged in the country due to the lack of tradition for those studies. It is expected thatthe experience acquired along time may bring stimulatio, information and additionalcontributions for the development of the sediment survey area.2. Reservoirs with sedimentation problems in BrazilSedimentological study is particularly important for Brazil since most electric powerplants in the country are hydraulic ones. Currently, over 90% of electric powerconsumed comes from hydraulic sources, and it is foreseen to remain like that for thenext three or four decades. Despite that, it is observed that sedimentological studies arenot deep enough or are incomplete. Hydrologic studies concerning rivers’ regimen,determination of discharges series and similar ones, are usually performed in a suitableway, while most sedimentological studies are carried out in an incomplete way. It isthought that this happens like that because most of the energy production in the countryis provided by large reservoirs, where the sedimentation issues are not regarded as veryimportant for production at short- and medium-term (Almeida and Carvalho, 1993).A World Bank study (Mahmood, 1987) illustrated that the average useful life ofexisting reservoirs in all countries of the world decreased from 100 to 22 years. Theannual cost for promoting the removal of the volumes being sedimented is estimated inUS$ 6 billion. It has also shown that annual average of reservoirs volume loss due tosediments deposition was of 1% varying from one country to another, as well as fromone region to another. Based on a survey carried out by Eletrobrás/IPH (1994) one canconclude that, in Brazil, the reservoir’s annual storage capacity loss is of about 0,5%(Carvalho, 1994). That index may correspond to storage capacity losses of 2.000 x10 6 m 3 per year, corresponding to a volume greater than several existing medium-sizereservoirs (Estreito, Jaguari, Moxotó, Salto Osório, Porto Colombia etc.). On the otherhand, it is observed that erosion is increasing in the country in face of population growthand soil management.Brazil has already several reservoirs totally or partially sedimented. Usually, thevisible sedimentation is the smallest part of deposit. Due to the lack of systematicsurveys – and dissemination of their outcomes – the condition of Brazilian reservoirs isnot known as would be desirable. Table 2.1 presents a list of reservoirs partially ortotally sedimented, based on information collected by Carvalho (1994 and 1998).ANEEL – Brazilian Electricity Regulatory Agency / SIH – Hydrologic Studies and Information Department5
Reservoir Sedimentation Assessment GuidelineTable 2.1 – Some reservoirs in Brazil partially or totally sedimented (Carvalho,1994 and 1998)Reservoir Stream Owner KindTocantins BasinItapecuruzinho Itapecuruzinho CEMAR UHE, 1,0 MWNorth Atlantic BasinsLimoeiro Capibaribe DNOS Flood controlSão Francisco BasinRio de Pedras Velhas CEMIG UHE, 10 MWParaúna Paraúna CEMIG UHE, 30 MWPandeiros Pandeiros CEMIG UHE, 4,2 MWAcabamundo Acabamundo DNOS Control of floodsArrudas Arrudas DNOS Control of floodsPampulha Pampulha SUDECAP Control of floodsAtlantic/East BasinsFunil Contas CHESF UHE, 30 MWPedras Contas CHESF UHE, 23 MWCandengo Una, BA CVI UHE, -Peti Santa Bárbara CEMIG UHE, 9,4 MWBrecha Piranga ASCAN UHE, 25 MWPiracicaba Piracicaba B.-MINEIRA UHE, -Sá Carvalho Piracicaba ACESITA UHE, 50 MWDona Rita Tanque - UHE, 2,41 MWMadeira Lavrada Santo Antônio CEMIG StorageGuanhães Guanhães CEMIG StorageTronqueiras Tronqueiras - UHE, 7,87 MWBretas Suaçuí Pequeno - -Sinceridade Manhuaçu CFLCL UHE,1,416 MWMascarenhas Doce ESCELSA UHE, 120 MWAreal Areal CERJ UHE, -Paraitinga Paraitinga CESP UHE, 85 MWItuerêFunilPombasParaíba do SulCFLCLFURNASUHE, 4,0 MWUHE, 216 MWJaguari Jaguari CESP UHE, 27,6 MWUna Una, SP PM Taubaté Water supplyParaná BasinPirapora Tietê - -Caconde Pardo CESP UHE, 80,4 MWEuclides da Cunha Pardo CESP UHE, 108,8 MWAmericana Atibaia CPFL UHE, 34 MWJurumirim Paranapanema CESP UHE, 22 MWPiraju Paranapanema CPFL UHE, 120 MWPres. Vargas Tibaji Klabin UHE, 22,5 MWPoxoréu Poxoréu CEMAT UHE, -São Gabriel Coxim ENERSUL UHE, 7,5 MWRib. Das Pedras Descoberto CAESB Water supplySão João São João ENERSUL UHE. 3,2 MWANEEL – Brazilian Electricity Regulatory Agency / SIH – Hydrologic Studies and Information Department6
Reservoir Sedimentation Assessment GuidelineUruguay BasinCaveiras Caveiras CELESC UHE, 4,3 MWSilveira Santa Cruz CELESC UHE, -Celso Ramos Chapecozinho CELESC UHE, 5,76 MWFurnas Segredo Jaguari CEEE UHE, -Atlantic/Southeast BasinsSanta Cruz Tacanica CCPRB UHE, 1,4 MWPiraí Piraí CELESC UHE, 1,37 MWErnestina Jacuí CEEE UHE, 1,0 MWPasso Real Jacuí CEEE UHE, 125 MW3. DEPOSITION OF SEDIMENTS IN <strong>RESERVOIR</strong>SThe stream, when entering the reservoir, has its cross-section areas enlarged,while the speed of the current decreases, thus creating conditions for sedimentdeposition. The heaviest particles, such as gravel and thick sand, are the first ones to besettled, while finest sediments enter into the reservoir. The dam hinders the passage ofmost particles for downstream; therefore, the passage may come to occur upon therunoff through the spillway and the ducts.As the sedimentation increases, the reservoir storage capacity decreases, theinfluence of backwater increases for the upstream, the velocities in the lake increase andmore sediment come to flow towards downstream, thus diminishing the particles trapefficiency.The sediments settled due to the influence of the reservoir, expand to upstreamand downstream, and are not equally distributed even within the lake. The upstreamdeposition is called backwater deposit, named after the hydraulic phenomenon, beingalso ascending since the deposits in that area increase. The depositions within thereservoir are called delta, overbank and bottom-set deposit. Coarses make up thedelta, while the inland deposits are made up by finer sediments (Mahmood, 1987).Floods produce another kind of deposition, occurring along both stream and reservoir,being made up by thin and coarses, named flood plain deposit.Such deposits cause different impacts or consequences. The backwater depositscause flood problems at upstream. The deposits in the lake cause reduction of thestorage capacity, and the variation of the water level shall determine the delta formation.While most delta deposits gradually reduce the useful capacity of the reservoir, theoverbanks reduce the dead storage. Part of the delta is also contained in the deadstorage. Those sediments reaching the dam and passing through spillway and ducts,cause abrasions on the structures, gates, piping, turbines and other pieces.At downstream, the clean water – i.e., with no sediments - as well as the changeon discharges regimen, shall cause erosion on both bed and banks of the channel, oreven huge excavations that may develop towards upstream, jeopardizing the damstructure.ANEEL – Brazilian Electricity Regulatory Agency / SIH – Hydrologic Studies and Information Department7
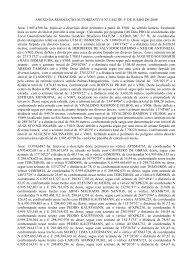
Reservoir Sedimentation Assessment GuidelineFigure 3.1 illustrates, schematically, the sediment distribution due to theexistence of the reservoir, and indicates the main resulting problems as well.Figure 3.1 Schedule on sediment deposits formation in reservoirs, indicating the mainissues resulting from it (Carvalho, 1994).Legend:Depósitos de remanso = backwater depositsDeclividade superior = higher slopeDelta = deltaN.A. max = maximum water levelN.A. min = minimum water levelPonto de escorregamento = sliding pointDeclividade frontal = front slopeLeito original (talvegue) = original bed (thalweg)Declividade de fundo = bottom slopeDepósito do leito = bed depositErosões, escavações no leito = bed erosion, excavationProblemas de enchentes e ambientais = flood and environmental problemsRedução da capacidade do reservatório e problemas ambientais = reservoir capacity reduction and environmental problemsRedução de capacidade útil = useful capacity reductionsRedução no volume morto = dead storage reductionProblemas de abrasão nas estruturas, comportas, tubulações, turbinas e peças = abrasion problems in structures, gates, tubes,turbines and partsProblemas ambientais e modificações na calha fluvial = environmental problems and changes on fluvial flumeRetirada de nutrientes e modificação da qualidade d’água = withdraw of nutrients and change on water qualityANEEL – Brazilian Electricity Regulatory Agency / SIH – Hydrologic Studies and Information Department8
Reservoir Sedimentation Assessment GuidelineOther problems deriving from sediments deposition may be noticed, and all ofthem require study and present distinct environmental impacts (Carvalho, 1994).Marginal deposits of fine sediments along stream and in the reservoir mayfacilitate the growth of aquatic plants, which are removed by the raise in water level.That fluctuating vegetation will cause several problems, such as its decomposition,deposition at the lake bottom and transformation into minerals, in addition to thesedimentation. Part of the vegetation will reach intakes, thus jeopardizing the operation,if they are not removed.Those sediments covering the bottom of the lake shall cause changes on bothfauna and flora of the bed. The clean water that flows towards the dam downstream,already without the nutrients carried sediments, shall cause changes on fauna and flora,with environmental impacts along the whole stream, specifically at the outfall. Theformation of estuary and delta at the sea may undergo severe environmental changes(Carvalho, 1994).4. THE RELEVANCE OF THE <strong>SEDIMENTATION</strong> <strong>ASSESSMENT</strong> SURVEYSedimentological studies must be carried out along all project stages, sinceplanning (inventory, feasibility and basic project) until the operation stage. During theinventory, if there are no gaging stations for measuring the sediment load, one or severalgaging stations are installed and operated, thus building up a sedimentometric network,which will be as large as the drainage area, and follow the importance of this study.The studies show that there are several kinds of approaches for the distinctstages of a reservoir project. As more serious the problems concerning erosion,sediments transportation and sedimentation presented are, either at stream or regionally,more detailed those approaches will be presented. Studies are carried out forestablishing the best sediment control measures that should be adopted.In any stage o the studies, the first steps are (Carvalho, 1994):• Survey on basin erosion conditions (soil management, deforestation, etc.);• Survey on existing or deactivated sedimentometric gaging stations;• Existing studies on the theme for the basin;• Collection of the required hydrologic and sedimentological data (series ofdischarges, sediment discharge, granulometry for suspended sediment and bed load andothers).In face of the lack of sedimentometric and hydrologic data, there is the need ofinstalling and running, in short time, a hydrological-sedimentometric gaging station ornetwork.The surveys to be performed concerning sedimentation forecast are as follows:ANEEL – Brazilian Electricity Regulatory Agency / SIH – Hydrologic Studies and Information Department9
Reservoir Sedimentation Assessment Guideline• Data processing (collection of parameters, average values, specific weight, sedimenttrap efficiency in the reservoir, increase on erosion index or sediment transportationand others);• Total sedimentation time for the reservoir;• Sedimentation time up to the intake level (useful life);• Height of deposits at the dam base for 50 and 100 years or other periods;• Distribution of sediments in the reservoir for 50 and 100 years, or other periods;• Tracing out of level x area x volume curves, both originals and for the sedimentedreservoir;• Percentage of the reservoir sedimentation for specific periods of time;• Amount of sediments settled in the volume set apart for controlling floods;• Top layer slope;• Front layer slope;• Effects of severe floods and sediments transportation (for small reservoirs);• If the sedimentation is a problem in a period twice the period of the reservoir usefullife (2x50 years), inclusively considering the sediment transportation rate alongtime, so determine preventive measures for controlling the sediment;• Studies on the forecast of erosion effects on the channel of the dam downstream;• Prevention control of sediments during the planning stages;• Preventive and corrective practices during the operation stage;• Other studies may be contemplated, such the one on secondary effects due todeposits and backwater monitoring, considering the reservoir sedimentation.4.1 Inventory stageUsually, during the inventory stage, one seeks for data from gaging stations fromthe Country’s main network. That network is under ANEEL responsibility, and theearlier gaging stations were installed in 1971 by the former DNAEE. The network wasexpanded and some gaging stations were replaced. Therefore, it is always necessary toreview such discontinuity through information contained in DNAEE Inventory ofFluviometric Stations. Old sedimentometric data, despite not reflecting current situation,may indicate the increase or decrease of the erosion rate in the basin, by comparingthose data with current ones.If there are not enough gaging stations, or if there is definitely no gaging station,then it is necessary to install one or more sedimentometric gaging stations and take thenecessary steps for their proper operation. If there is no gaging station along the streamcourse, primary studies may be performed by using sedimentometric data of neighborANEEL – Brazilian Electricity Regulatory Agency / SIH – Hydrologic Studies and Information Department10
Reservoir Sedimentation Assessment Guidelinebasins reporting similar features. However, it is necessary to install gaging stations atthe focus area, in order to grant studies for the following stages.Sedimentological studies for assessing sedimentation based on those data shallindicate the need of short- or medium term preventive sediment control.4.2 Feasibility and basic project stagesThe sedimentological studies at the inventory stage should point out therequirements for further stages. If there are no of such studies, the need of surveying theexistence of gaging stations nearby the project area will arise. The installation andoperation of a gaging station at the site of or nearby the forthcoming dam is the mostsuitable solution.The studies shall be more refined and expanded, for verifying the basin featuresjointly with regional aspects concerning erosion occurrence.The sedimentation assessment during those stages shall include computation ofreservoir life; the sediment deposit height at the dam base or at the water intakeposition; the reservoir useful life and the sediment deposition after 100 years. The rateof sediment transportation along the stream or the basin erosion rate shall be obtainedand considered while assessing the sedimentation and, mainly, when estimating thereservoir useful life.4.3 Operational stageSedimentological studies shall not cease upon the conclusion of the dambuilding works. On contrary, at that stage, the monitoring of sediment effects in face ofthe reservoir development should be even highlighted. Works like that necessarily bringregional development and, therefore a territorial occupation that includes improved soilmanagement for agriculture – due to the increase on water availability -, the building ofroads and a set of changes whose consequences may have not been adequately assessedduring planning studies.The steps for performing sedimentological studies at the operation level includemonitoring of secondary fluvial-sedimentometric network – installed during previousstages -, and topo-bathymetric surveys for the reservoir, surveys and follow-up studieson erosion effects at downstream, and sediment-related environmental impacts.The secondary sedimentometric network shall monitor at least 80% of the damdrainage area; the local gaging station shall be replaced by one station downstream andanother one upstream the backwater area.The reservoir systematic topo-hydrograph survey is a requirement fordetermining water availability through new level x area x volume curves, assessing the11ANEEL – Brazilian Electricity Regulatory Agency / SIH – Hydrologic Studies and Information Department
Reservoir Sedimentation Assessment Guidelinenew reservoir contour, the pivot point, as well as several additional pieces ofinformation (please refer to the item on measurement of reservoir sedimentation). Itwould be advisable to have small reservoirs surveyed at every two years; the mediumsizeones at every five years, and the large ones at every 10 years. It the new surveypresents small variation concerning sedimentation, so the survey interval may be longer,and the changes taking place in the basin due to land occupation and consequentincrease of erosion should be monitored.Comparative satellite-based studies for different periods of time allow forobtaining several pieces of information on changes occurring in the concerned reservoirarea.Data obtained from both operation of sedimentometric network and survey datamay allow for the assessment of the reservoir remaining useful life. For thoseassessments, the surveys used for forecast shall be repeated.5. FACTORS AFFECTING SEDIMENTS YIELDSediments reaching the reservoir come from the inflow drainage area and aretaken mainly through the major fluvial channels network.The production of sediment deriving from drainage area – or corresponding to awhole hydrograph basin – depends on erosion, rainwater runoff with the transportationof sediments, and characteristics of sediment transportation along streams as well.1989):The main factors affecting the sediments yield at the drainage area are (ICOLD,• Precipitation – quantity, intensity and frequency;• Kind of soil and geological formation;• Soil coverage (vegetation, apparent rocks and others);• Soil management (cultivation practices, grazing grass, forest exploitation,building activities and conservation measures);• Topography (geomorphology);• Nature of the drainage network– density, slope, shape, size and channelsconfiguration;• Surface runoff;• Sediments features (granulometric, mineralogical etc.);• Channels hydraulics.Additional factors may be added, as well as likely combinations among the nineabove-mentioned factors. For the assessment of sediments yield in a drainage areainflowing the dam position, it is necessary to have an expert assessment on the mostinfluencing factors. It shall, necessarily, lead to the measurement conclusions requiredANEEL – Brazilian Electricity Regulatory Agency / SIH – Hydrologic Studies and Information Department12
Reservoir Sedimentation Assessment Guidelineto accurately define the sediments amount, available techniques for foreseen suchsediment production or even to assess the quantity of sediments at basins where duemeasurements have not yet taken place.6. <strong>RESERVOIR</strong> <strong>SEDIMENTATION</strong> <strong>ASSESSMENT</strong>The assessment on the sedimentation of the reservoir total volume and useful lifeis essential for surveys about the lake formation, as well the evaluation of the reservoiroperation. The end of its useful life - in sedimentological terms - is considered as whendeposits come to interfere on the regular operation of either the plant or of the reservoirpurpose. Additional evaluations shall be performed, according to the time taken by thesediment to reach the intake sill (useful life), sediments distribution along the reservoir -corresponding to a given period -, the pivot point development and delta building (upand frontal slope).For the preliminary sedimentation computation, the following mathematicalexpressions are used:SDxE365xQxEst rst r= =(6.1)γapγapVresT = (6.2)Swhere:S = volume of sediment trapped in the reservoir (m 3 /year);D st = annual average for total bed load inflowing the reservoir (t/year);E r = trap efficiency for the sediment inflowing the reservoir (decimal);γ ap = deposits specific weight (t/m 3 );Q st = total average sediment discharge inflowing the reservoir (t/day);T = sedimentation time for a given volume (years);V res = reservoir volume, total or dead storage (m³).For items 7, 8 and 9, equations 6.1 and 6.2 indicate how to determine theparameters required for evaluating the sedimentation.6.1 Reservoir dataThe main project data required for such forecasts are:• Maximum normal water level, in m;• Minimum normal water level, in m;• Intake sill height, in m;• Volume of maximum normal water level, in m 3 ;• Volume of minimum normal water level (dead storage), in m 3 ;• Volume of intake sill, in m 3 ;• Natural discharges series;ANEEL – Brazilian Electricity Regulatory Agency / SIH – Hydrologic Studies and Information Department13
Reservoir Sedimentation Assessment Guideline• Long-term average discharge, in m 2 /s;• Spillway sill level, in m;• Intake sill level, in m;• Reservoir length, in m or km.7. SEDIMENT PRODUCTION DETERMINATIONThe entity responsible for building the hydroelectric plant - or any other kind ofwater resources project available – and that comes to create an impounded river reacharea, should seek for hydrologic and sedimentological data with other entities existingalong the stream course. If there is no data available, the entity must, therefore, installand operate gaging stations for that purpose. Bathymetric survey data for reservoirscould also be used, but they are scarce. Other studies that might be obtained are data onthe basin erosion rates assessment, has required for the accurate sedimentation forecast.It is necessary to regularly get suspended and bed granulometric data forcomputing the specific weight. It is also essential to measure the sediment discharge insedimentological surveys for small- and medium-size reservoirs, since coarse (sand) isnever discharged through ducts and spillway; therefore, it remains deposited in thereservoir. Exception is made to the small quantity of sand being discharged duringsevere floods.Studies concerning sediment production are presented in more details in theSedimentometric Practices Guideline and are outlined herein.Generally, for implementing a program on sedimentometric measures –according to the International Hydrologic Program – UNESCO (1982) has establishedthe criteria presented in Table 7.1, according to Yukian (1989).Table 7.1 – Program on acquisition of sedimentometric data according to UNESCO(1982) and Yukian (1989)Gaging itemSurvey Purpose Bathymetric Survey SedimenttransportationAnnual runoffSedimentsconcentration,suspended discharge,total discharge inhydrometric gaging1) Erosion anddeposition in riverreaches;2) Reservoir capacitydepletionPeriodic surveys via crosssectionand longitudinallines in the river orreservoir reach; full surveyon the reservoirsedimentationstationsTotal inflow or outflowsediment discharge inhydrometric gagingstationsOther relevant itemsWater level, netdischarge and othersSediment granulometryand specific weight ofdepositsFluvial processes in Periodic surveys along the Bed and bed load Relevant hydraulic andANEEL – Brazilian Electricity Regulatory Agency / SIH – Hydrologic Studies and Information Department14
Reservoir Sedimentation Assessment Guidelineriver reach or reachessusceptible toreservoir backwaterriver reach or in interestingsites; aerial photography, ifpossibledischarge in affluenthydrometric gagingstationssedimentologicalparameters such as waterline slope, bed loadcomposition, velocity,depth and width, watertemperature,granulometry ofsediment being carried,specific weight, etc.High values of sediment production, such as 200 t/(km 2 .year), are veryprejudicial and may come to affect the reservoir with undesired deposits. According tointernational criteria, the values reported in Table 7.2 may be used as indicators forsurveys.Table 7.2 – Acceptable values for sediment productionToleranceSediments yield(ton/(mi 2 .year) (t/(km 2 .year)High > 500 175Moderate 200 to 500 70 to 175Low < 100 357.1 Erosion AssessmentSoil erosion is a complex process presented in different ways in nature, andwhose measurement is also complex. Seet erosion surveys are the commonestphenomena and are not measured. Similar studies from the USLE, Universal soil lossequation that may be expanded to any area by using the modified equation MUSLE existonly for agriculture, in some Brazilian regions. Despite that resource, the valuesobtained through such equations are high and may not be used for studying sedimenttransportation. For comparison purposes, the average results obtained as acceptable inagriculture for rates from 3 to 15t/(ha.year), equivalent to 300 to 1500t/(km 2 .year), aremuch higher than the values presented in Table 7.2 for sediment transportation rates.That is true, since not all sediments eroded in the basin reach the stream, and, therefore,part of sediment remains in depressions and plain areas.7.2 Sedimentometric gaging stations networkingThe sedimentometric gaging stations network for a basin may be dimensionedfollowing WMO criteria (WMO, 1994). It is regarded as the most useful network forbasic studies. Currently, ANEEL is responsible for that network in Brazil, monitoring alittle more than 300 gaging stations – an amount lower than WMO criterion – due tooperational costs. Countries such as Canada and Russia, reporting the same continentaldimension, also have sedimentometric networks with few gaging stations, such as ours.Therefore, a secondary network must be usually considered for meeting the needs ofANEEL – Brazilian Electricity Regulatory Agency / SIH – Hydrologic Studies and Information Department15
Reservoir Sedimentation Assessment Guidelinespecific surveys, with more frequent operations, as is the case for implementing gagingstations for reservoir sedimentation assessment. That network shall remain operationalduring the operation stage.For implementing surveys about river or reservoirs reaches it is useful to know –or measure/monitor – the inflowing of sediments for at least 80% of the inflow basin,being necessary to obtain both suspended and total sediment discharge. For studies onexisting reservoirs, considering an investigation monitoring, it is necessary to monitor atleast 60% of the tributary basin and install a gaging station downstream for identifyingthe effluent sediment. The tributaries that directly discharge into the lake, and report acontribution of sediment higher than 10% of the total tributary shall also be monitored(Yuqian, 1989).7.3 Gaging station installation and measurement frequency***Level readings and net discharge gaging shall be performed when measuringthe sediment discharge, and the gaging station shall be regularly operated. Therefore,the sedimentometric gaging station may be selected among the fluviometric networkgaging stations holding historical data. For installing a new gaging station, the site shallbe selected following the same criteria as for the fluviometric gaging station.In sedimentometric gaging station where it is intended to measure the bed load,it would be useful to use a complementary gaging station, with the same reference andduly located, in order to determine the water line slope for each measurement.The measurement frequency for either the sedimentometric gaging station ornetwork must be planned jointly with the fluviometric network operations; specialattention shall be addressed to the phenomenon of variation for bed sediments duringrainy times and occurrence of precipitations.Usually, the suspended load is the prevailing piece for the total bed sediment;that is why the frequency is establishing aiming at measuring the suspended discharge.The measurement may occur hourly, daily, weekly, monthly or even periodically.Recording devices may perform the continuous operation at a stream point.Hourly measurements may be performed with automatic pumping equipmentwith rotating trays. Daily measures or collection are generally performed by the gagingstation observer in two or three pre-established vertical sections; during drought times,measures are to be performed at every 15 days. In large streams, the sediment collectionmay be performed weekly; however, recent studies on rivers of that nature haveevidenced that such variations may occur even daily.Hydrometry team shall assist monthly or periodic measurements. Suchmeasurements shall be performed following the full sampling criterion and not just forone to three selected vertical sections. Punctual measurement, either using automaticANEEL – Brazilian Electricity Regulatory Agency / SIH – Hydrologic Studies and Information Department16
Reservoir Sedimentation Assessment Guidelineequipment or register such as hourly, daily or weekly collection, shall be followed bymeasurements performed by the hydrometry expert for calibration purposes.The measurement performed by the hydrometry expert shall include bothsuspended sediment load and bed load collection. The measurement of watertemperature measurement and slope measurement are also required.Most of the stream’s bed sediment occurs during rainy period, corresponding toabout 70 to 90% of annual total load. Therefore, it is useful that measurement frequencycomprises such period, and that few measurements remain for drought period.Sediment measurements are relatively more expensive than the remainingmeasurements for water resources surveys, due to the complexity of the phenomenonand to its difficult computation, as well. Currently, by using computers that facilitatesuch computations, it is possible to upgrade any measurement software in order to reachgreater accuracy and better outputs.7.4 Measurement MethodsThe different measurement methods for suspended bed load or total load areclassified as direct (or in situ) and indirect. Table 7.3 shows, in a simple way, suchmethods.Table 7.3 – Methods for gaging bed sediment (Carvalho, 1994)SedimentdischargeSuspendedsedimentdischargeMeasurementDirectDescriptionUses equipment that measures theconcentration or any other value, suchas turbidity or ultrasound directly in thestreamThrough sediment accumulation in ameasurer (graduated test tube)Measurement equipment ormethodologyNuclear measurer (portable orfixed), Optical ultrasonic flowmeter, Doppler Ultrasonic Flowmeter, Turbidimeter (portable orfixed)ADCP (Doppler)Delft Bottle (punctualmeasurement and highconcentration)Several kinds of equipment: -pumping, equipment using bottlesor bags, being punctualinstantaneous, punctual throughintegration and verticalintegrators (in Brazil, the North-American series– U-59, DH-48,DH-59, D-49, P-61 and bagsampler are the mainly ones thatare used)IndirectSediment collection by sampling of thewater-sediment mixture, concentrationand granulometry analysis and furthercomputation on sediment dischargeANEEL – Brazilian Electricity Regulatory Agency / SIH – Hydrologic Studies and Information Department17
Reservoir Sedimentation Assessment GuidelineBed loadentrainment dischargeDirectIndirectDirectUse of satellite pictures and comparisonwith simultaneous field measures forcalibration in large rivers.Samplers or portable measurers of threemain kinds (the sampling is collected inseveral points of the cross-section,determining its dry weight, thegranulometry and calculating theentrainment discharge); the measurer isfixed on the bed from 2 minutes to 2hours, in such a way as to receive in itsreceiver from 30 to 50% of its capacityCrevasse or water well structures – thebed crevasses are opened for a fewminutes and the sediment is collectedBed load collection, granulometricanalysis, slope gauge, temperaturehydraulic parameters and computationon entrainment discharge and bed loadthrough formulas (Ackers and White,Colby, Einstein, Engelund and Hansen,Kalinske, Laursen, Meyer-Peter andMuller, Rottner, Schoklitsch, Toffaleti,Yang and others)Dunes displacement – by measuring thevolume of the displacing dune, usinghigh-resolution echobathymeter1) Radioactive trackers2) Dilution trackers, being bothmethods by setting the tracker on thesediment and monitoring it by using thesuitable equipment (the tracker shall bechosen in such a way as to avoidpolluting environment)Lithologic properties – use ofsediments’ mineralogical featuresAcoustic method – used for stonesstriking against the measurementSampling photograph method – usedfor stones. A scale is settled and alsophotographedUse of block-type structures, on thebed, to cause turbulence and allsediments become suspendedEquations are established in orderto correlate the values of pictureobservation and measuredconcentrations1) Crate or case - Muhlhofer,Ehrenberger, SwitzerlandAuthority and other measurers2) Tray or tank – measurersLosiebsky, Polyakov, SRIH andothers3) Pressure difference –Helley-Smith, Arnhem, Sphinx, USCE,Károlyi, PRI, Yangtze, Yangtze-78 VUV measurers and othersMulhofer measurer (USA)Kinds of equipment:1) horizontal penetration, likedredge and shell bucket2) vertical penetration, likevertical tube, scraper bucket,excavation bucket and gravelexcavation3) piston-core, which holds thesampling though partial vacuum1) successive bathymetric surveysalong the cross-section2) successive bathymetric surveysalong longitudinal sectionsMethods:1) by settling the tracker directlyon the bed sediment2) by collecting sediment, settlingthe tracker on the sediment andreturning it to the bed.Collection of tributaries and mainbed sediment, determination ofsediments’ mineralogical featuresand comparison by using suitableequations based on the quantityof components existing in thesampling(Unsatisfactory)1) Photos of underwater stones2) Photos of dry beds stonesSediment sampling is performedand computed as suspendeddischargeANEEL – Brazilian Electricity Regulatory Agency / SIH – Hydrologic Studies and Information Department18
Reservoir Sedimentation Assessment GuidelineSedimentdischargetotalIndirectTopo-bathymetric survey for thereservoir, determination of depositsvolume and trap efficiency in the lakeCollection of suspended and bedmaterial, concentration analysis,granulometric analysis, temperaturemeasurement, hydraulic parameters andcomputation of total discharge –Einstein’s method modified andColby’s method simplified1) For small reservoirs, it allowsfor the computation of bedsediment2) For large reservoirs, it allowsfor the computation of totalsedimentSeveral kinds of equipment –pumping, equipment using bottlesand bags, being instantaneouspoint, points by integration andvertical integrators (in Brazil ismainly used the North-Americanseries U-59, DH-48, DH-59, D-49, P-61 and bag sampler)Several measurement or suspended sampling equipment may be classified indifferent kinds, such as:• Instantaneous or integrators, where the instantaneous quickly gets the sampling orread them, while integrators admit sampling in a few seconds through a beak or abill, storing it in a recipient;• Portable or fixed, where portable ones are manually operated, by pole or shrill, oreven fixed to a boat, while the fixed ones are installed in a adequate structure, eitheron a bridge or at the bed;• Beak or with bill, where the beak are of pumping or other, and those using bills arethe portable ones furnished with bottles, plastic recipient or plastic bag;• Punctual instantaneous, punctual by integration and by vertical integration, wherepunctual instantaneous are cylinder-like with a device for capturing the samplingsending a messenger/weight that closes the valves. The punctual by integrationcollects sampling in a few seconds at a vertical point. The vertical integrators or indeep waters collect sampling by moving the equipment along vertical in a steadymovement that may be in a single way or back and forward from surface to bottom.• Horizontal tube sampler, of bottle, collapsible bag, pumping, integration,photoelectrical, nuclear, optical ultrasonic flowmeter, dispersion ultrasonic,Doppler Ultrasonic Flowmeter– the horizontal sampler is a punctual instantaneousone. The bottle sampler is hydrodinamically built and has a cavity for inserting acollection bottle; the sampling is performed through a bill that may report severaldiameters (1/4”, 3/16” e 1/8”) while the air is expelled through a tube. Thecollapsible bag sampler is also hydrodinamically built and has an aluminum-maderecipient for holding the plastic bag, which is compressed in order to expel the air;its capacity is greater than the bottle’s capacity and it also uses exchangeable bills.The pumping device may be settled on a boat or installed at the bed; normally, it isused a hose furnished with a beak or a bill adjusted for allowing in the sampling;the pumping is monitored according to the stream velocity, and there are severalkinds of such equipment. The equipment working through integration is bottle orbag collapsible . The photoelectrical and the nuclear ones operate through light andrays, respectively, through a constant intensity source. The optical and thedispersion ultrasonic work with sources that produce ultrasonic rays that arereceived by adequate equipment. The Doppler Ultrasonic Flowmeter uses Doppler19ANEEL – Brazilian Electricity Regulatory Agency / SIH – Hydrologic Studies and Information Department
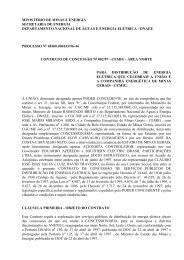
Reservoir Sedimentation Assessment Guidelineeffect to measurement the intensity of acoustic energy reflected by the particlessuspended in the water, thus providing a correlation between the amount of decibels(dB) received by the equipment (for example, ADCP) and the distribution ofsuspended sediments along the gauging section.• The equipment may also be classified according to its bills or beaks orientation,such as on the stream direction or at 90 o with the stream.Note – The North-American collection equipment for suspended material havedenominations indicating their origin: US, for United States; kind of usage: D, fordepth, for vertical integration or in deep waters; and, P, punctual, for punctual sampling;light equipment, manual, are represented by H, of hand; the number corresponding tothe project, 48, for 1948.The most used equipment in the country for sediment load sampling is from theNorth-American series, bottle-type, of collapsible bag and punctual measurer withrecipient, for determining the bed sediment by indirect method (Figures 7.1, 7.2, 7.3,7.4, 7.5, 7.6 and 7.7). Bed load collection equipment, for indirect measurement as well,is that of horizontal or vertical penetration (Figures 7.8, 7.9, 7.10 and 7.11).Figure 7.1 – Single stage sampler US-U-59, punctual by integration, for fixedinstallation and surface collection when water level increasesANEEL – Brazilian Electricity Regulatory Agency / SIH – Hydrologic Studies and Information Department20
Reservoir Sedimentation Assessment GuidelineFigure 7.2 – Sampler US-DH-48, integrator-type, for wading measurement or for useon boat up to 2,0m in deep waters, and currently has two versions: DH-59 and DH-76Figure 7.3 – Sampler US-DH-59, integrator-type, for use through shrill in deep watersup to 4,50m and moderate velocityFigure 7.4 – Sampler US-D-49, integrator-type, for use through shrill in depths up to4,50m and high velocities, and currently has two versions: D-74 and D-74ALANEEL – Brazilian Electricity Regulatory Agency / SIH – Hydrologic Studies and Information Department21
Reservoir Sedimentation Assessment GuidelineFigure 7.5 – Sampler US-P-61, punctual integrator-type, may perform collectionthrough vertical integration, on parts, at any depth, and has the following versions: P-50, P-61A1, P-63 e P-72Figure 7.6 – Collapsible bag sampler, integrator-type, for use with shrill at any depthFigure 7.7 –Delft Bottle, punctual integrator-type, for direct measurement ofconcentration also using a graduated test tubeANEEL – Brazilian Electricity Regulatory Agency / SIH – Hydrologic Studies and Information Department22
Reservoir Sedimentation Assessment GuidelineFigure 7.8 – Sampler of the U.S. Waterways Experimental Station for bed materialFigure 7.9 – Petersen sampler for bed loadFigure 7.10 –US-BMH-60 sampler for bed material in moderate depths and velocities;it has a lighter version for hand use, the RBMH-80ANEEL – Brazilian Electricity Regulatory Agency / SIH – Hydrologic Studies and Information Department23
Reservoir Sedimentation Assessment GuidelineFigure 7.11 –US-BM-54 sampler for bed material for deeper water and highervelocitiesNote – The North-American series equipment identified by US, for United States, fordirect bed load measurement are indicated as BL, for bed load, while the simplecollection for indirect measurement, are indicated by BM, for bed material, and may behand-operated whenever labeled as H, for hand; the number corresponds to the projectyear.7.4.1 Sediment samplingThere are several kinds of sediment load sampling, which may be punctual or byvertical integration. Table 7.4 presents the usual sampling methods.Table 7.4 – Methods for sediment samplingSampling Positions Average concentrationIn pre-established position when using anautomatic equipment (pumping) ormeasurer (turbidimeter, nuclear or other)PunctualA surface site with sampler or directlywith the semi-sunk bottle, in everyvertical sectionAverage concentration in the sectiondetermined through calibration andbased on the correlation with thehydrometrist's measurementsAverage concentration on the verticalsectionC mv = 1,2 C supPunctualA point at the vertical at 0,5 or 0,6 indepthTwo points at the vertical at 0,2 and 0,8in depthAverage concentration on the verticalsectionC mv = C 0,5 or = C 0,6Average concentration on the verticalsection3 5C mv= C0,8+ C8 80,2ANEEL – Brazilian Electricity Regulatory Agency / SIH – Hydrologic Studies and Information Department24
Reservoir Sedimentation Assessment GuidelineVerticalintegrationThree points at the vertical at 0,2, 0,5 and0,8 in depthSeveral points on the vertical section, at0,1, 0,3, 0,5, 0,7 and 0,9 (if concentrationvalues vary too much, the average shouldbe computed by weighing it with depthsamong the measured points)Using different transit rates for thesampler at each vertical section.Method of Equal Increment of Width,(IIL), using the same transit rate for allverticals and the same bill along theentire cross-sectionMethod of Equal Increment of Discharge(IID), performing the sampling at themiddle point of equivalent dischargeincrements along the whole crosssection,where the bill may be changedand one may use different transit rates foreach vertical, however sampling equalvolumes of the mixture water-sedimentAverage concentration on the verticalsectionC,2+ C0,5+C mv=3or,0C0,8C,2+ . C0,5+C mv=402 C0,8Average concentration on the verticalsection∑CiCmv=nConcentration is the average at thevertical section.The suspended sediment dischargeshould be determined by multiplyingsegments for the partial discharge,where the total suspended discharge isequivalent to the sum of partial valuesand the average concentration for thesection is equivalent to the totalsuspended discharge, divided by thetotal net discharge.All vertical sub-samplings are gathered(from 10 to 20) and a single analysis isperformed, thus providing the averageconcentration and, if required, a singleaverage granulometric curve for thesectionAll vertical sub-sampling are gathered(from 5 to 15) and a single analysis isperformed, thus providing the averageconcentration and, if required, a singleaverage granulometric curve for thesectionFor those sampling methods, the bottle should never be totally full; it isrecommended to collect no more than 400ml for bottles with total capacity of 500ml.The samplers using that kind of bottle cannot collect samplings in very deep waters,being the DH-48 for depths up to 2,0m, and the DH-59 and D-49 for depths up to4,50m.For the vertical integration process, the sampler is submerged and moved in asteady velocity, from surface to the bottom, then returning to surface. Each up or downmovement happens in a constant velocity, but not necessarily in equal velocities. Thesampler transit rate shall not be higher than a given value v t which must be computeddue to the constant of the bill used and the average velocity at the vertical (equations 7.1ANEEL – Brazilian Electricity Regulatory Agency / SIH – Hydrologic Studies and Information Department25
Reservoir Sedimentation Assessment Guidelineand 7.2). The minimum sampling time is computed by using a course equivalent totwice the depth (equation 7.3).1/8” Bill: vt, máx= 0,2.vm(7.1)3/16” and 1/4" Bills: vt, max= 0,4.vm(7.2)Minimum sampling time:tmin2. p= (7.3)v t , máxThe IIL and IID methods are regarded as the best ones, since they allow fordetermining the average concentration and average granulometry upon one singleanalysis (Table 7.4), besides facilitating sediment discharge computations. The totalvolume of the sub-sampling to be collected should allow the analysis following therestriction criterion for each process available at laboratory.It is usual to collect enough suspended material - from 10 to 15% ofmeasurements performed - with mixture of water-sediment, in order to allow thegranulometric analysis of that material (ICOLD, 1989).Bed material sampling is performed at some intermediary positions among thesame verticals, as for the IIL and IID methods, using from 5 to 10 sub-samplings. Thetotal weight for sub-samplings should be equivalent to 2kg, or a little higher, in order toallow the successful analysis by the laboratorist.7.4.2 Laboratory AnalysisThe sediment analysis for suspended material is performed in laboratories likethe Chemistry ones, while the bed material analysis is performed in laboratories such asthe Soil Mechanics ones. Therefore, the laboratorist must combine the procedures byusing the equipment suitable for each method.The sediment load analysis, despite being performed with the equipment usedfor Chemistry – such as analytical balance, becher, pipette, capsules, test tubes and soon – is not a chemical analysis; rather it is a sedimentometric analysis. It means that allsamplings, when delivered at the laboratory, shall be analyzed and must not be dividedor reduced for a sub-sampling for a supposed homogenization. Particles contained in amixture water-sediment report several distinct densities and sizes, like colloids, argyle,silts and even sand, as well as different mineralogy (quartz, iron, calcium, etc.);therefore it is impossible to have them homogenized. All sediments received by thelaboratory must be analyzed.The different usual analysis and methods, or equipment, may be viewed in Table7.5. For a better understanding on the methods, it is useful to see Guy (1969).ANEEL – Brazilian Electricity Regulatory Agency / SIH – Hydrologic Studies and Information Department26
Reservoir Sedimentation Assessment GuidelineTable 7.5 – Methods and equipment for sedimentometric analysisSuspended sedimentsamplingTotal concentration analysisGranulometric analysisFiltration methodEvaporation methodSettling tube methodSettling tube methodPipettingDensimeterBed load samplingGranulometric analysisSifteringDensimeterPippetingVisual accumulation tubeSettling tube methodEach method has its own restriction, thus demanding suitable quantities ofsediment contained in the sampling. The filtration method is used for low-concentrationsamplings – lower than 200mg/l – and small volume, in order to avoid obstructing thefilter. The evaporation method is used for higher-concentration and higher-volumesamplings. Both methods require the reduction of the sampling volume, by decantationor water-bath, in such a way as to hold all particles along the process. According toWMO (WMO, 1981), the required volumes for an accurate analysis are those presentedin Table 7.6.Usually, concentration is determined as the ratio between the dry sedimentweight and the volume of the water-sediment mixture, in mg/l, or the ratio between thedry sediment weight and the water-sediment mixture weight, in ppm (= mg/kg =mg/1.000.000mg). The ppm values may be used as mg/l up to 16.000ppm with nodensity adjustment. Data may be presented with three significant algorisms up to 999(0,32ppm, 3,21ppm, 32,1ppm, 321ppm).Table 7.6 – Volumes of sampling required for suspended sediments concentrationanalysis (WMO, 1981)Expected concentration of sedimentloadSampling volume(g/m 3 , mg/l, ppm)(liters)> 100 150 to 100 220 to 30 5< 20 10Granulometric analyses for suspended material are performed with smallquantity of sediments, using the principle of the particles water dropping velocity. EachANEEL – Brazilian Electricity Regulatory Agency / SIH – Hydrologic Studies and Information Department27
Reservoir Sedimentation Assessment Guidelinemethod, thought based on Stokes law, has its restriction for reaching the desiredaccuracy when surveying the percentage of sediments for a given granulometry in liquidmeans. Table 7.7 presents the major restrictions to be obeyed.Table 7.7 – Amplitude of several granulometric analysis methods forfine material using water-dropping velocity(SUBCOMMITTEE ON <strong>SEDIMENTATION</strong>, 1943)MethodApproximate limit of theparticle diameterApproximate limit inconcentration(mm)(ppm)Settling tube 0,001 to 1,0 300 to 10.000Decantation 0,001 to 0,0625 1.250 to 19.000Pippeting 0,001 to 0,0625 3.000 to 10.000Hydrometer (densimeter) 0,001 to 0,0625 60.000 to 116.000Siltmeter (TAV, visual accumulation tube) 0,0625 to 2,0 125 to 25.000Bed load analysis is performed mainly through siftering, using the Tyler seriesof sifters. For small quantities of sandy material, the TAV method can be used. If theremainder for the last sifter – the finer material – is equivalent to 5% of the material, orhigher, it is necessary to complement the analysis by defining the curve lower segment.One of the methods presented in Table 7.7 should be used for that. The analysisprocedures may be consulted in Normas e Recomendações Hidrológicas – Anexo III,Sedimentometria (DNAEE, 1970).7.4.3 Sediment discharge computationOnce all field and laboratory data are available, sediment dischargecomputations may be performed. The required data are obtained from net dischargemeasurement and sediments sampling, sediments concentration, granulometricdistribution and others. For calculating the bed discharge by using formulas, one mustobtain some additional values, such as water temperature, energy line slope, shearingtension, kinematic viscosity, particle-dropping velocity; usually, those last ones areincluded in the computation programs available.The maximum error expected for sediment discharge determinations is 10%,even including the bed discharge collection, which is very inaccurate. Suspendeddischarge is usually the prevailing part of the total discharge, representing more than90% for most measurements. However, the bed discharge may report values from 10 to150% in relation to the suspended discharge, according to ICOLD (1989). On the otherhand, the sedimentometric data consistency analysis is very hard, due to the severalprocesses required for determining it, mainly, the phenomenon complexity. Therefore, itis essential to try to eliminate errors during the measurement and for the laboratorywork. Consequently, the sediment discharge measurement shall be performed asaccurately as possible in the field, by a successful hydrometologist, using the suitableANEEL – Brazilian Electricity Regulatory Agency / SIH – Hydrologic Studies and Information Department28
Reservoir Sedimentation Assessment Guidelineequipment, and the analysis should be performed by an experienced chemistryexpert/technician. That shall allow repeating the computations, if required. If field andlaboratory services report errors, the adjustment of the sediment discharge valuebecomes impossible.Suspended sediment discharge computation – In both direct and indirectmeasurement for suspended discharge, the concentration value is obtained. Thecomputation is performed by multiplying the net discharge by the concentration.Usually, the Q ss value is presented in t/day, and it requires a unity transformation factor.For the average concentration obtained through ILL and IID sampling methods:where,Q ss = 0,0864.Q.c s (7.4)Q ss = suspended sediment discharge, in t/dayQ = net discharge, in m 3 /sc s = concentration, in mg/lIf c s is a high value, presented in kg/m 3 , the equation is:Q ss = 86,4.Q.c s (7.5)If the samplings are for several verticals separately analyzed, the followingequation is used, with the due constant on unity transformation:Q ss = Σ q ss = Σq.Δl.c sv (7.6)whereq ss = suspended discharge for width unity corresponding to the segment beingconsideredq = partial net discharge for width unity corresponding to the segment beingconsideredΔl = distance referenced to q ss and qc sv = sediment concentration at vertical.The average concentration on the vertical is equivalent to:∑ qssQsscs = =(7.7)∑ q QComputation of sediment discharge and bed load – The direct measurementdetermines the dry sediment and the bed discharge is calculated as:(7.8)ANEEL – Brazilian Electricity Regulatory Agency / SIH – Hydrologic Studies and Information Department29
Reservoir Sedimentation Assessment GuidelinewhereQ b = sediment discharge, in t/dayq b = sediment discharge at a given point, in kg/(s.m)l = distance between the measured points, in mE r = equipment sampling efficiency.For that kind of measurement, the formula must take into consideration theequipment trap efficiency, the value of which is determined in laboratory.For indirect measurement, the sediment discharge computation is throughformulas. Stevens & Yang (1989) have studied the several formulas available andselected 13 as the most recommendable (Table 7.8). Besides that, they have preparedcomputer programs that are available in the above-mentioned publication.Table 7.8 – Summary of the main formulas for calculating sediment discharge and bedmaterial, as presented by Stevens & Yang (1989)Formula authorYearEntrainmentdischarge (B) orbed materialdischarge (BM)Kind offormula(1)Kind ofsediment(2)GranulometryAckers & White (*) 1973 BM D S S, GColby 1964 BM D S SEinstein (bed load) 1950 B P M S, GEinstein (bed material) 1950 BM P M SEngelund & Hansen (*) 1967 BM D S SKalinske 1947 B D M SLaursen 1958 BM D M SMeyer-Peter & Muller (*) 1948 B D S S, GRottner 1959 B D S SSchoklitsch (*) 1934 B D M S, GToffaleti 1968 BM D M SYang (sand) (*) 1973 BM D O SYang (gravel) (*) 1984 BM D O G(1) Deterministic (D) or Probabilistic (P)(2) Granulometric sand fraction (S), composition or mixture (M) or optional (O)(3) Sand (S) or gravel (G)(*) Regarded as the most reliable by Stevens & YangTotal sediment discharge computation – The approximate total sediment dischargemay be obtained by summing up the suspended discharge and the bed materialdischarge. Nevertheless, that procedure is questionable due to the inaccuracy reportedby non-sampled zones.The total sediment discharge may be obtained through computation processes ofEinstein’s modified method and by Colby’s simplified method. Otto Pfafstetterconverted the first method into the metric system, where the abacus depends on units,adjusted by Carvalho (1994). Stevens (1979) prepared a computer program for usingANEEL – Brazilian Electricity Regulatory Agency / SIH – Hydrologic Studies and Information Department30
Reservoir Sedimentation Assessment Guidelinethat method. Carvalho (1981) has also converted the second method into the metricsystem.If there are some measurements using Einstein’s modified method – which isvery hard to do – such values may be used for correcting Colby’s simplified method orfor obtaining correlations for correcting the total discharge (Yuqian, 1989).Establishing the sediment discharge value– Considering that the only data availableare for suspended sediments only, the calculator tries to establish the value of the nonmeasureddischarge, in order to have the total discharge required by sedimentationassessment. In Brazil, it is usual to determine such value as 10%, while there arecountries where utilities establish up to 30% of the suspended discharge. ICOLD (1989)presents a suggestion for selecting the method for obtaining sediment discharge, inrelation to bed material and sand percentages existing in the suspended sampling (Table7.9). The table shows the complexity of establishing just the %.Table 7.9 – Guide for correcting the sediment discharge and for orienting the methodfor obtaining such discharge (ICOLD, 1989)ConditionConcentration ofsediment load(mg/l)% of bed load inrelation to thesuspended loadBed material Granulometry ofbed material1 (1) < 1000 Sand 20 to 50% of sand 25 to 1502 (1) 1000 to 7500 Sand 20 to 50% of sand 10 to 353 > 7500 Sand 20 to 50% of sand 54 (2) Any concentration Compacted argyle,gravel, rolledstones or stonesAny amount up to25% of sand 5 to 155 Any concentration Argyle and silt No sand < 2(1) Special sampling for computations through Einstein’s modified method are required for thiscondition(2) A program for direct measurement using a Helley-Smith sampler, or other measurer, or even using theformulas for thick material7.5 Data processingData processing is intended to obtain average discharge and average runoff loadeither annual or for a period, as well as to obtain representative parameters for thephenomenon.The first step is an adequate revision of both field and laboratory documentationand, following, the tabulation of measurements performed. The table shall have thefollowing items: number of measurement, date, values for average level, section width,area, average depth, average speed, net discharge, concentration of dissolved solidmaterial, sediments concentration, suspended sediment discharge, entrainment bed loador bed material discharge, total sediment discharge and method for obtaining such data.Granulometric curves shall be always available for further use. One can also make aANEEL – Brazilian Electricity Regulatory Agency / SIH – Hydrologic Studies and Information Department31
Reservoir Sedimentation Assessment Guidelinetable with the percentage of some diameters and characteristic values for usual bedmaterial (D 10 , D 35 , D 50 , D 65 and D 90 ).7.5.1 Continuous, hourly and daily measurementsContinuous, hourly and daily measurements shall also be tabulated and thesediment discharge must be computed. The preliminary work consists of calibratingconcentration values, as based on the correlation with the hydrometrist’s data. If a valueis not available because it was not measured, than a graph with a discharge hydrogramis prepared, as well as the respective plotting on concentration or suspended discharge,for obtaining the lacking values. Those values may also be obtained from the ratingcurve sediments equation prepared with the values measured.After the daily tabulation, it is possible to obtain monthly and annual tabulation,containing the summaries of average net and load discharges. Following, an annualsummary is prepared, presenting total annual transport (runoff load D s ), annual averagetransport (average annual sediment discharge Q s ), sediments contribution (production ofsediments P s ) and other values. Table 7.10 presents an example of semi-annual bulletinof computations performed by CEMIG. The average for average annual values will beused for the sedimentation assessment computations.ANEEL – Brazilian Electricity Regulatory Agency / SIH – Hydrologic Studies and Information Department32
Reservoir Sedimentation Assessment GuidelineTable 7.10 – Semi-annual bulleting on suspended discharge - São Francisco River in Porto dasAndorinhasTransporte total anual = annual total transportationMáximo transporte diário = maximum daily transportationMínimo transporte diário = minimum daily transportationMáxima concentração anual = maximum annual concentrationMínima concentração anual = minimum annual concentrationSumário anual = annual summaryDeflúvio total anual = annual total runoffTransporte médio anual = annual average transportationEscoamento específico = specific runoffContribuição de sedimento = sediment contribution7.5.2 Eventual measurementsData processing for eventual measurements is performed by preparing thesediment transportation rating curve using either concentration or sediment discharge inconnection with the net discharge. A common practice is to work with the bilogarithmicsheet, such as the example in Figure 7.12. The curves may be obtainedthrough visual process or through the minimum squares method, as used for Excel. Oneshould be very careful when using the computer, mainly when there is a dataconcentration that may come to influence the curve direction. It is a common practice toANEEL – Brazilian Electricity Regulatory Agency / SIH – Hydrologic Studies and Information Department33
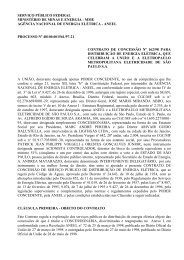
Reservoir Sedimentation Assessment Guidelineassimilate one or more straight lines and get the respective exponential equations,similar to the one presented below. For obtaining more than one line, the sedimentdischarge or the net discharge shall be ascending ordered.Q = a.Qsn(7.9)Figure 7.12 – Sediments rating curve for Manso River in Porto de Cima –measurements for the period 1977/1981 (Carvalho, 1994)Descarga líquida = net dischargeDescarga sólida total = total sediment dischargeThe respective loads, as well as the average values and required parameters maybe obtained through the rating curve equations for a given period. When a series ofdischarges for several years is available, it is used for obtaining the sediment dischargeseries, by accepting the equation as valid for the period (see examples in Tables 7.11and 7.12).ANEEL – Brazilian Electricity Regulatory Agency / SIH – Hydrologic Studies and Information Department34
Reservoir Sedimentation Assessment GuidelineTable 7.11 –Manso River in Porto de CimaSérie de vazões anuais = annual runoff seriesAno = YearANEEL – Brazilian Electricity Regulatory Agency / SIH – Hydrologic Studies and Information Department35
Reservoir Sedimentation Assessment GuidelineTable 7.12 – Manso River in Porto de CimaANEEL – Brazilian Electricity Regulatory Agency / SIH – Hydrologic Studies and Information Department36
Reservoir Sedimentation Assessment GuidelineDescarga sólida total media mensal = Total monthly average sediment discharge7.5.3 Data regionalizationIf there are data for at least two gaging stations along the stream, average valuesfor each gaging station shall be computed, a line concerning the drainage area is drawnand the runoff value is obtained by using the gaging station drainage area (see Figure7.13 of the example for São Francisco River and Rio das Velhas, according to Carvalho,1994).Figure 7.13 –São Francisco Basin – Sediments yield lines (Carvalho, 1994)Produção de sedimento = sediment yieldÁrea = areaThe regionalization for data concerning the same basin may also be performedthrough the analysis of local features in relation to the basin features (see Figure 7.14where the sediment discharge value in UHE Mascarenhas, at the Rio Doce wassearched). The regionalization of sedimentometric data is tricky, and must be carefullyperformed; therefore, it is not recommended.Scientific works like global curves shall not be used for studies, rather, they areused just for curiosity purposes.ANEEL – Brazilian Electricity Regulatory Agency / SIH – Hydrologic Studies and Information Department37
Reservoir Sedimentation Assessment GuidelineFigure 7.14 – Example of sedimentometric data regionalization – Relation betweendischarges and load discharges in basins neighboring Rio Doce basin –Measurements from 1960 to 1971 (Carvalho, 1994)Rio = riverPosto = stationPeríodo = periodFor data regionalization concerning different basins, one should try to verify thecurves that may be obtained and use the one whose features are compatible with thegaging station position. In the example for Figure 7.15, the higher curve was used forobtaining the sediment production in dam construction sites in Doradas River. Note thatthe curve reports a P s value corresponding to the gaging station at that stream (point 6).ANEEL – Brazilian Electricity Regulatory Agency / SIH – Hydrologic Studies and Information Department38
Reservoir Sedimentation Assessment GuidelineFigure 7.15 –Regionalization with data from several basins (Carvalho, 1994)Produção de sedimento sólido total = total sediment yieldRio = riverLocal = site8. TRAP EFFICIENCY IN <strong>RESERVOIR</strong>SThe sediments trap efficiency value in reservoirs may be obtained based onsystematic measurements of tributary load discharges and discharges downstream. Forsurveys previously to damming, the curves obtained from existing reservoirs surveys areused. For medium and large reservoirs, the Brune curve is used; for small reservoirs theChurchill curve is used.8.1 Medium and large reservoir casesThe Brune curve presents at the ordinate axis the value for trap efficiency in thereservoir, either in percentage or in fraction and, at the abscissa axis, the affluencecapacity, corresponding to the reservoir volume divided by the annual average tributary39ANEEL – Brazilian Electricity Regulatory Agency / SIH – Hydrologic Studies and Information Department
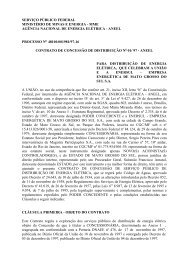
Reservoir Sedimentation Assessment Guidelinerunoff. For that, it is used the reservoir volume corresponding to the normal maximumwater level. The Brune curve may be obtained in Carvalho (1994), Morris/Fan (1997),Strand (1974) or Vanoni (1977).Figure 8.1 – Curves on reservoirs trap efficiency, according to Brune (Vanoni, 1977and others)Sedimentos retidos = trapped sedimentsRelação capacidade/volume afluente anual = ratio capacity/annual tributary volumeSedimento grosso = coarseSedimento fino = fine sedimentCurva média = average curve8.2 Small reservoirsThe Churchill curve is presented in three versions, and requires attention whenbeing used. In any of them, the ordinate axis represents the percentage of tributarysediment passing downstream. Therefore, the trap efficiency is obtained by differenceand shall be expressed in fraction for computation purposes.The Churchill curve presented by Morris/Fan (1997), Strand (1974) or Vanoni(1977) is illustrated in Figure 8.2. In it, the abscissa axis corresponds to the value of theReservoir Sedimentation Index IS that is equivalent to the Retention period divided bythe Reservoir average velocity. Those parameters are computed as follows:• Retention period = reservoir volume (ft 3 ) divided by the daily average dischargeduring the survey period (ft 3 /s);• Average velocity in the reservoir = average daily discharge (ft 3 /s) divided by theaverage cross-section area (ft 2 ). The average cross-section area may be determinedby dividing the reservoir volume by its length (ft).ANEEL – Brazilian Electricity Regulatory Agency / SIH – Hydrologic Studies and Information Department40
Reservoir Sedimentation Assessment Guideline10010Sedimento localSedimento fino descarregado dereservatório a montante11.0E+04 1.0E+05 1.0E+06 1.0E+07 1.0E+08 1.0E+09Sedimentation IndexFigure 8.2 – Curve on the trap efficiency, according to Churchill, versionpresented in Vanoni, 1977Sedimento local = local sedimentSedimento fino descarregado de reservatório a montante = fine sediment discharged by upstream reservoirThe reservoir volume corresponds to the capacity at the average operation level.Usually, small reservoirs operate at run-of-river level, and the volume of that level is theone to be used. Deriving from the above information, one can reach the followingexpression for the Sedimentation Level used for the Churchill curve version presented inFigure 8.2:IS = Retention Period (8.1)Average Speedwhere:IS = Reservoir sedimentation index;V res = Reservoir volume at the average operation level (ft 3 );Q = Daily tributary discharge average during the survey period (ft 3 /s);L = Reservoir length (ft).Another version of the Churchill curve, presented by ICOLD [1989], has on itsordinate axis, at the upper corner of the illustration, the Churchill sedimentation indexmultiplied by the gravity acceleration g , where:2VresIS.g = .g(8.2)2Q .LANEEL – Brazilian Electricity Regulatory Agency / SIH – Hydrologic Studies and Information Department41
Reservoir Sedimentation Assessment GuidelineFigure 8.3 – Curve on sediments trap efficiency, according to Churchill, versionpresented in ICOLD (1989), where: 1: Annual Average Tributary Reservoir Capacity /Flow; 2: Sediment Trapped, in %; 3: SIxg – Sedimentation Index x g (gravityacceleration constant); 4: Average Brune Curve and; 5: Churchill CurveA third view on Churchill curve, modified by Roberts, is presented by Annandale(1987), to be used in metric system. In the graph (Figure 8.4), the ordinate axis isexpressed as in Figure 8.2; the difference is according to the curve presentation.100101Sedimento localSedimento fino descarregado de umreservatório a montante1.0E+05 1.0E+06 1.0E+07 1.0E+08 1.0E+09 1.0E+10 1.0E+11Sedimentation Index - ISFigure 8.4 –Sediment trap in the reservoir, according to Churchill (Annandale, 1987)Sedimento local = local sedimentSedimento fino descarregado de reservatório a montante = fine sediment discharged by upstream reservoirANEEL – Brazilian Electricity Regulatory Agency / SIH – Hydrologic Studies and Information Department42
Reservoir Sedimentation Assessment Guideline9. SPECIFIC WEIGHT OF DEPOSITSThe runoff load is usually computed in terms of weight by time, as t/year, andshall be converted into equivalent volume, as m 3 /year, by knowing the specific weight.Lara and Pemberton realized - by performing researches with samplings from existingreservoirs – that the specific weight for sediment deposits may be computed accordingto the kind of operation for the specific reservoir, the level of sediment compaction andgranulometry, which are the most influent factors for deposits consolidation. Lessinfluent facts may be mentioned, such as the density of the reservoir’s stream sediment,the slope for the tributary stream thalweg and the vegetation effect on the reservoirheadwaters area.9.1 ComputedThe computation for initial specific weight, and after compaction, for a giventime, is performed by using the following equations; the parcel factors for suchequations are obtained based on the kind of operation for the reservoir (Table 9.1).γi= W . P + W . P + W . Pccmmssγ = γ + K.logTfor specific layerTior⎡ T ⎤γT= γ i+ 0,4343.K ⎢ ( LnT ) −1⎥ for total deposit⎣T−1⎦K = Kc. Pc+ Km.Pm+ Ks. Pswhere:γ i = initial specific weight (t/m 3 );W c , W m , W s = coefficient of compaction for argyle, silt and sand, respectively, obtainedaccording to the kind of reservoir operation (Tables 9.1 and 9.2);P c , P m , P s = fractions of quantities of argyle, silt and sand contained in the tributarysediment;γ T = average specific weight in T years (t/m 3 );T = settled sediment compaction time (years);K = constant depended on sediment granulometry and based on the kind of reservoiroperation (Table 9.2);Ln = Neperian logarithm.The values for coefficients γ i , γ T and K, as presented by Strand, were adjusted tobe used in the metric system (Carvalho, 1994).ANEEL – Brazilian Electricity Regulatory Agency / SIH – Hydrologic Studies and Information Department43
Reservoir Sedimentation Assessment GuidelineTable 9.1 – Kind of reservoir operation (adapted from Strand, 1974)KindReservoir Operation1 Sediment always, or almost always, submerged2 Little to medium reservoir depletion3 Reservoir reporting significant level variations4 Reservoir usually emptyTable 9.2 - W and K constants for calculating the specific weight in relation to the kindof reservoir operation, to be used in the metric system (adapted from Strand, 1974)Kind Argyle Silt SandW c K c W m K m W s1 0,416 0,2563 1,121 0,0913 1,5542 0,561 0,1346 1,137 0,0288 1,5543 0,641 0,0000 1,153 0,0000 1,5544 0,961 0,0000 1,169 0,0000 1,554Note: K constants for sand are null for any kind of operation.To use the equations and their respective tables, it is necessary to obtain the averagepercentages of argyle, silt and sand contained in both suspended and bed sediments, aswell as percentages for average suspended sediment discharge and the average bedsediment discharge. Following, the required composition should be performed in orderto know the percentages of argyle, silt and sand (coarse) referring to total sedimentdischarge.If, for example, the average sediment discharge computation indicated 85% forsuspended discharge and 15% for bed discharge, the average granulometry among theseveral analysis of the suspended sediment sampling for the observation period resultedin 45% of argyle, 50% of silt and 5% of sand, and the analysis for the bed resulted in3% of argyle, 8% of silt and 89% of sand, therefore the computations for obtaining P c ,P m and P s may be performed as presented in Table 9.3.Table 9.3 – Examples of computations for average percentage of argyle, silt and sandfor use in Lara and Pemberton formulas, to obtain the specific weight in reservoirsArgyle%Silt%Sand%Q ss%Q sa%P c%P m%P s%Suspended sediment 45 50 5 85 - 0,45x85=38,250,50x85=42,500,05x85=4,25Bed sediment 3 8 89 - 15 0,03x15=0,450,08x15=1,200,89x15=13,35Total 38,7 43,7 17,6Once computed the total percentages for P c , P m and P s , the trap efficiency for thereservoir must be verified. The percentage of fine sediments flowing through the ductsmust be subtracted from the fine sediment, in order to calculate the specific weight.ANEEL – Brazilian Electricity Regulatory Agency / SIH – Hydrologic Studies and Information Department44
Reservoir Sedimentation Assessment Guideline9.2 MeasuredThere are two processes for measuring the specific weight, namely direct andindirect. For the indirect process, or in situ, it is used the nuclear measurer, densityradioactive-type. For the indirect process, it is used to collect a non-deformed sampling,by using equipment like gravity or piston-core; to measure the sampling volume, take itto the stove and determine the dry weight. Such measurements shall be performed alongdifferent positions in the reservoir, in order to verify the variation of specific weight andobtain the average value.9.3 EstimateAccording to the equations, one may assess the variation of initial specificweight as follows:- If sediment is exclusively argyle, then γ i shall range from 0,42 to 0,96;- If sediment is exclusively silt, then γ i shall range from 1,12 to 1,17;- If sediment is exclusively sand, then γ i shall be equivalent to 1,55;- If there is a composition reporting similar portions of argyle, silt and sand, there is avariation from 1,02 to 1,22.In small reservoirs, sand is the main material settled; therefore, the initialspecific weight is established as ranging from 1,4 to 1,5 t/m 3 ; medium-size reservoirsmay report a composition with specific weight ranging from 1,2 to 1,4 t/m 3 , while forlarge reservoirs, where just a few quantity of fine sediments passes through the ductsand spillways, that amount may range from 1,1 to 1,3 t/m 3 . Obviously, knowing thebasin and quality of existing sediments, as well, may allow for the technician to performbetter assessments.For a more accurate assessment on apparent weight, one may use those valuespresented by Zhide (1998), Tables 9.4 and 9.5.Table 9.4 – Average initial specific weight of deposits in reservoirs, in t/m 3 (Zhide,1998)Kind of reservoir operationArgyle( < 0,004mm )Silt(0,004-0,062mm)Sand(0,062-2, 0mm)Sediment always, or almost always submerged 0,416 1,120 1,550Little to medium depletion of the reservoir 0,561 1,140 1,550Reservoir reporting significant level variations 0,641 1,150 1,550Reservoir usually empty 0,961 1,170 1,550ANEEL – Brazilian Electricity Regulatory Agency / SIH – Hydrologic Studies and Information Department45
Reservoir Sedimentation Assessment GuidelineTable 9.5 – Long-term average specific weight of deposits in reservoirs, in t/m 3(Zhide, 1998)SedimentGranulometry(mm)Specific weight(t/m 3 )Argyle < 0,005 0,8 a 1,2Silt 0,005 a 0,05 1,0 a 1,3Medium and thin sand 0,01 a 0,5 1,3 a 1,5Thick sand and thin gravel 0,5 a 1,0 1,4 a 1,8Medium gravel > 1,0 1,7 a 2,1ANEEL – Brazilian Electricity Regulatory Agency / SIH – Hydrologic Studies and Information Department46
Reservoir Sedimentation Assessment Guideline10. FORECAST OF A <strong>RESERVOIR</strong> <strong>SEDIMENTATION</strong>10.1 Sedimentation assessment methodsThe forecast methods for a reservoir sedimentation evaluation are tasks relatedto the intended objective. During the inventory stage, the main objective is to estimatethe total sedimentation period, as well as the reservoir useful life. If there is anyindication of serious problems during the useful life, surveys may be deepened in orderto improve the economic estimates for the arrangements. During feasibility and basicproject stages, the studies are a little harder; they seek to review the sedimentationeffects and general solutions for controlling sediments (preventive control) as well.During the operation stage, the goal is to check on sedimentation through systematicsurveys, sedimentometric monitoring, surveillance on basin changes and other studies,always aiming at the possibility of preventive control and, whenever that control is notpossible, the most suitable corrective practices.An evaluation comprising only volumes and sedimentation time may beperformed by using equations 6.1 and 6.2. However, it is not enough for characterizingthe sedimentation; therefore, it is necessary to perform more appropriate studies takinginto consideration forecast, as indicated in item 4, and the stage of study. The tributarysediment inflowing the reservoir may become settled in or leave the dam. The depositsformed may be permanent or, in some cases, may move along the reservoir. Duringflood occasions some sediments may be displaced and cross the dam.Usually, the fine sediment, reporting granulometry lower than 0,062mm, maymove in suspension along the reservoir, thus forming density streams. For largereservoirs, part of that fine sediment may become settled closer to the dam, while part ofit may run downstream. The coarse, with granulometry higher than 0,062mm, usuallybecomes settled in the reservoir and builds up the delta. As deposits are formed, coarsesenter the reservoir, and become settled upstream, thus increasing backwater area. Theprocess is a complex one, and its studies are properly performed by sedimentshydraulics formulas. The study may be carried out by using Saint Venant equations fornet runoff, or by using some modified sediments transportation formulas (Bruk, 1985).Currently, there are several methods for forecasting sedimentation and depositsdistribution. The method most frequently used is the HEC-6, which allows for differenttypes of studies, and is available in free-use software.Simpler methods, semi-empirical, based on reservoirs systematic surveys are, forexample, the Borland & Miller’s empirical method for reducing the area, and theincremental area method. Both of them have been disseminated in several books(Strand, 1974; Vanoni, 1977; Annandale, 1987 and Morris/Fan, 1997).10.2 Assessment of total sedimentation, dead storage and useful lifeANEEL – Brazilian Electricity Regulatory Agency / SIH – Hydrologic Studies and Information Department47
Reservoir Sedimentation Assessment GuidelineThis evaluation may be performed through equations 6.1 and 6.2. Using asexample Itaipu (Paraná River) and Itiquira (Itiquira River) reservoir, Table 10.1 displayscomputation data and results.SDxEst rst r= =andγap365xQγapxETV=Sreswhere:S = volume of sediment trapped in the reservoir (m 3 /year);D st = total annual average sediment tributary to the reservoir (t/year);E r = tributary trap efficiency in the reservoir (% and fraction);γ ap = average specific weight for deposits (t/m 3 );Q st = average total tributary sediment discharge to the reservoir (t/day);T = sedimentation time for a given volume (years);V res = reservoir volume, total or dead storage (m³).Table 10.1 – Assessment of reservoirs sedimentation of UHE's of Itaipu and Itiquira(see Carvalho, 1994 and Carvalho et al, 2000)DataItaipu Reservoir(ITAIPU BINATIONAL)Itiquira Reservoir(ITICON S.A.)Normal maximum water level 220,00 m 412,00 mUsual minimum water level 197,00 m 411,50 mWater level at the intake sill176,00 mMax. Normal Water Level Volume 29 x 10 9 m 3 4,8 x 10 6 m 3Min. Normal Water Level Volume 10 x 10 9 m 3 4,2 x 10 6 m 3Dead storage (at sill intake) 4,7 x 10 9 m 3 3,9 x 10 6 m 3Long-term average discharge Q mlt 9.729 m 3 /s 72,9 m 3 /sReservoir length 170 km 5.600 m− 31 8,9034Q = 1,704x10. QstEquations for sediments transportation for Q < 10000 m 3 /s Q st = 46,888 x Q 0,9472(period 1979/1982)− 6 2,5146Q = 6,121x10. Qstfpr Q > 10000 m 3 /sAnnual total sediment dischargeaverage Q st (obtained through theequation and discharges series)Annual total solid runoff average D st (= 365 x Q st )Obtaining trap efficiency E r(period 1988/1989)71.063 t/day(period 1931/1992)2.715 t/day(period 1931/1997)30.788.845 t/year 990.775 t/yearBrune Curve:Affluence capacity =0,098E r = 86%According to Roberts(Annandale, 1987), Churchillcurve9,8x(4,8x106)2IS . g == 7,6x10(72,9)2x5600ANEEL – Brazilian Electricity Regulatory Agency / SIH – Hydrologic Studies and Information Department48
Reservoir Sedimentation Assessment GuidelineSpecific weight γ apAnnual average sediment volume(computed based on the equation forsediment transportation and dischargesseries)Sedimentation time for total volume,in max. normal water levelSedimentation time for total volume,in min. normal water levelSedimentation time for a volumeequivalent to the volume at the intakesill (reservoir useful life)Sedimentation time for total volume,considering the increase on sedimenttransportation since when sedimentdischarge measurements took place(1982)E r = 45% (adopted 50%)According to Lara and According to Lara andPembertonPemberton1,13 t/m 3 1,5 t m 323,37 x 10 6 m 3 /year 330.325 m 3 /year1240 years 14 years430 years 12,7 years200 years 12 years------15 months10.3 Assessment of a reservoir useful lifeUnder a sedimentological perspective, a reservoir useful life is considered aswhen sediments reach the intake sill and starts disturbing or hindering the operation.For a computation more accurate than the one presented in Table 10.1, thesediment distribution in the reservoir and the increase on either erosion index orsediment transportation must be taken into consideration. One may calculate the heightof the sediment deposit at the dam’s base, or at the intake position for different times,and depict an assessment graph in order to get the forecast on how long will it take forthe deposits to reach the sill. The methods for performing such computation werepresented in item 10.1.10.4 Sediments distribution in reservoirsAs presented in Chapter 3 (see Figure 3.1), the sediments deposits in a reservoirare irregularly formed, occurring the formation of a delta in the backwater area thatexpands towards the lake along time and in face of greater bed sediment. Fine sedimentsbecome settled inner and closer to the dam.The assessment of such distribution may be performed through several methods,as mentioned in item 10.1.10.5 Increase on basin erosionThe increase on sediment transportation along a stream is a consequence of anincrease on the basin’s erosion. Having data on annual average sediment discharge for49ANEEL – Brazilian Electricity Regulatory Agency / SIH – Hydrologic Studies and Information Department
Reservoir Sedimentation Assessment Guidelineseveral years, and their respective average discharges, one can calculate the rate ofincrease for sediment transportation, by using the mass curve. An illustrative example ispresented, taken from the work of Carvalho/Guilhon/Trindade (2000) on reservoirsedimentation assessment for Itiquira, in Itiquira River, State of Mato Grosso.The years near to 1980 presented major transformations for the region, due to theexpansion of agricultural area, which caused the intensification of erosion. By that time,huge formations of erosion gullies took place at São Gabriel do Oeste, located in theneighborhood of Taquari River basin. It led International Organizations to cooperate inthe reconstitution of terrains and guidance on the proper soil management.In order to review erosion development through the analysis of stream’ssediments transportation, the data on net discharge and total sediment discharge, asprovided by the gaging station in Itiquira River upstream the BR-163 Highway wereused. Two sediments rating curves were prepared, being the first one for the years1979/1980 (Figure 10.1) and the second one for the years 1981/1982 (Figure 10.2). It isrecommended to have data enough in order to provide rating curves as accurate asdesired, preferably for each year.10,0001,000Qst = 2029,4Ln(Q) - 6286,3R 2 = 0,320310010 100 1000Net Discharge (m³/s)Figure 10.1 – Total sediments rating curve in Itiquira, period 1979/1980(Carvalho/Guilhon/Trindade, 2000)10,0001,000Qst = 4130,6Ln(Q) - 13842R 2 = 0,660110010 100 1000Net Discharge (m ³/s)Figure 10.2 - Total sediments rating curve in Itiquira, period 1981/1982(Carvalho/Guilhon/Trindade, 2000)ANEEL – Brazilian Electricity Regulatory Agency / SIH – Hydrologic Studies and Information Department50
Reservoir Sedimentation Assessment GuidelineUsing the corresponding equations and data from the monthly discharges series,the annual average values and annual sediment discharge were obtained for therespective years, accumulated as showed in Table 10.2.Table 10.2 – Values for accumulated discharges and sediment- Itiquira, from 1979 to 1982Years1979198019811982DischargesAccumulated DischargesSedimentdischargeAccumulated Sedimentdischarge(m 3 /s) (m 3 /s) (t/day) (t/day)112,1 112,1 3.036 3.036109,1 221,2 3.040 6.07588,3 309,5 4.473 10.54888,3 397,8 4.374 14.923Then, data on accumulated discharges and sediment discharges were used for themass curve (Figure 10.3). By observing that curve, one may come to the conclusion thatthe sediment transportation through the stream increased in the period from 1979 to1982, thus evidencing the basin’s erosion increase, due to anthropic actions.16,00012,0008,0004,00000 100 200 300 400Accrued net discharge (m³/s)Figure 10.3 – Sediments mass curve for Itiquira - period 1979/1982(Carvalho/Guilhon/Trindade, 2000)The variation rate for sediment transportation may be computed from the ratiobetween sediment discharges and corresponding discharges as (see Table 10.2):3.036 + 3.040r1== 27,5 and112,1 + 109,1r2=4.473 + 4.37488,3 + 88,3ANEEL – Brazilian Electricity Regulatory Agency / SIH – Hydrologic Studies and Information Department51
Reservoir Sedimentation Assessment GuidelineThe rate of sediment transportation increase for the period is computed as:E c=r2− r1r1= 0,82It means that there was an increase of 82%on the sediment transportationbetween 1979 and 1982 - a very high amount for the short period being surveyed, whatmay come to jeopardize the reservoir due to very quick sedimentation.The annual rate computation, considering the small sampling for 4 years, isperformed by using the following equation:(1+ R i)4 =1,82thus resulting in the value of 16.15% for the annual increase on sediment transportation.For the percentage sedimented along 10 years or in a given period, t, thecomputation is as follows:10(1 + 0,1615) −1= 3,47 = 347% and ( 1+ R )t −1P11. MEASUREMENT OF A <strong>RESERVOIR</strong> <strong>SEDIMENTATION</strong>i=All reservoirs will become sedimented sooner or later. The main issue is toensure that there will be no problem that comes to hinder the reservoir operation withinits economical useful life. On the other hand, one should try to minimize the secondaryeffects resulting from sediment.Therefore, the sedimentation forecast is performed during the planning stage,and deposit formations, as well as sedimentation effects, are monitored during theoperation stage, no matter the reservoir size.Surely, this kind of study always brings about experience and new knowledge inthe field of Sedimentology. Therefore, the sedimentometric monitoring of gagingstations along the stream, the verification of erosion problems at the lake bed anddownstream channel, as well as the topo-bathymetric survey for reservoirs bringsubsidies for both undertakers and Science.11.1 Purpose of the surveyThe survey includes both terrestrial and underwater parts, as may be relevant tothe studies. The comparison between two surveys performed at different times is made,even if using aerophotogrametric interpretation map for the planning stage. TopographicANEEL – Brazilian Electricity Regulatory Agency / SIH – Hydrologic Studies and Information Department52
Reservoir Sedimentation Assessment Guidelinereferences must be the same. The surveys must report the same accuracy level in orderto grant comparable results.The determination of the new capacity and sedimentation level is the mainpurposes of the topo-bathymetric survey. Summarily, the following survey outputs maybe mentioned:• Determination of either the reservoir volume or capacity under current conditions(by the time of the survey), as the remaining capacity;• Determination of the new water body area;• Drawing new level x area and level x volume curves;• Drawing of the new bed geometry for the reservoir;• Drawing the new pivot point curve;• Verification of physical characteristics of accumulated sediments;• Quantification of sedimentation volume for the period, by comparing with previoussurveys or with the map at the reservoir formation time;• Determination of the reservoir trap capacity;• Determination of average tributary sediment discharge;• Verification of percentage of sediment settled in reservoirs, dead storage and thevolume lost in useful volume area.11.2 Frequency of surveysThe frequency of surveys in reservoirs depends on several factors; the main onesare: the reservoir’s total capacity and the likely amount of sediment deposit due to theriver bed sediment. The small reservoirs, as well as those whose tributary bed sedimentis high, shall be more frequently surveyed. On the other hand, the reservoirs withreduced tributary bed sediment shall have their survey frequency reduced. That is thecase, for example, when the drainage area is reduced due to the construction of a dam atupstream (Vanoni, 1977), or even when the tributary basin had its sediment dischargevalue reduced due to protective measures.The financial cost is a factor that greatly influences the reservoirs surveyfrequency. Usually, resources for such works are limited, mainly because the sedimentis submerged, where managers cannot reach.. Considering that the survey cost isjustified by an update on the reservoir capacity verification and its sedimentationvolume, the criterion indicated in Table 11.1 can be considered. It is evident that thesurveys shall be performed more frequently in reservoirs where high indexes ofsediments deposit are reported.ANEEL – Brazilian Electricity Regulatory Agency / SIH – Hydrologic Studies and Information Department53
Reservoir Sedimentation Assessment GuidelineTable 11.1 – Desired frequency for topo-bathymetric surveys in reservoirsReservoir size Classification in volume Survey frequency(m 3 )SmallMediumLarge< 10 x 10 6from 10 to 100> 100Every 2 yearsEvery 5 yearsEvery 10 yearsNote: The classification presented hereby is not strict, and may have different concepts in othercountriesSome of the following reasons or steps may help in reducing the frequency, orassist the decision-making concerning the need of a survey (Vanoni, 1977):• Data on sedimentometric measurements at the tributary area report high runoff load;• Observations of areas that are usually submerged during reservoir depletionoccasions;• Review of the accuracy of the reservoir capacity curve, by occasion of tributary andeffluent volume computations during the operation surveys;• Measurements for identifying some reservoir bathymetric sections;• When special problems related to sediment deposition in a reservoir appear (forexample, a huge flood may cause the sedimentation of a small reservoir and must beverified; erosion and fall of big talus greatly contributing to deposits).The studies on reservoir sedimentation monitoring are commonly performedthrough a periodic survey in some sections. This practice does not offer accuracyenough for the monitoring of sedimentation and useful life. However, if the survey ofsuch sections is carried out among comprehensive surveys, the result may be used in thedecision-making process concerning extension for the next survey.The stage of a comprehensive topo-bathymetric survey provides more accuratelylevel x area and level x volume curves when the reservoir is full, if compared to thosesurveyed through aerophotogrametric interpretation, which normally do not take intoconsideration the riverbed.Other works such as, for example, suspended sediments and bed sedimentssampling for characterizing the material follow the studies. The bed sediment samplingshall include the determination of specific weight based on non-deformed samplings ordirect measurements. This measure is necessary because of deposits compaction due towater weight or geological activities (ICOLD, 1989).11.3 Survey methodsThe general procedures for reservoirs surveys have undergone changes due toscientific development and the emergence of new technologies and equipment.Basically, the general procedure consists of building up the bathymetric map for theANEEL – Brazilian Electricity Regulatory Agency / SIH – Hydrologic Studies and Information Department54
Reservoir Sedimentation Assessment Guidelinelake bottom, which may be compared to a previously prepared map (Bruk, 1985). Themost frequent methods for reservoir survey are:1) Survey method of reservoir contour;2) Survey method of topo-bathymetric lines.The method selection depends on the availability and conditions of previousmapping, on the study objectives, on the reservoir size and on the accuracy levelintended.11.3.1 Survey on the reservoir contourThis sort of survey is restricted to small reservoirs, or to reservoirs that may haveits level lowered. Usually, the cost for this kind of survey is very high, but it is veryaccurate.The contour survey method basically uses the procedures of topographicmapping by aerophotogrametry, obtaining photos of the reservoir at several differentlevels. The method is especially suitable for aerial surveys, when one may programflights for different levels of reservoir depletion, in a relatively short time span.11.3.2 Topo-bathymetric surveyThe reservoir topo-bathymetric survey using the cross-sections survey method ismuch more used for medium and large reservoirs (Bruk, 1985). Basic procedures are asfollows:• Obtaining reservoir maps on suitable scale;• Preliminary exploration;• Search for altimetric survey marks and coordinates;• Planning of sections to be surveyed;• Selection of working methods and equipment (including proper boats,communication means during works, well trained team, etc.);• Determination of the survey reduction level, usually the maximum normal level;• Installation of limnimetric rules along the reservoir for monitoring levels;• Installation of new reference marks;• Depth measurement and simultaneous location of such points (height or levels);• Interpretations, computations, mapping, cross-sections draws and others;• Preparation of the report containing maps, draws and conclusions.Once identified the reference marks for heights and coordinates, the next step isthe implementation of new marks at cross-sections and their identification. The currentmethod, that uses DGPS, waivers the installation of marks in all sections, beingnecessary the installation of just a few. The installation shall be planned according toANEEL – Brazilian Electricity Regulatory Agency / SIH – Hydrologic Studies and Information Department55
Reservoir Sedimentation Assessment Guidelinethe reservoir size. The different technologies available will guide the remainder work interms of terrestrial support service, management equipment, staffing, and survey time aswell as in clerical services, such as mapping, required computation and conclusiveresult. Modern methodologies allow for a more accurate survey, which may beperformed in shorter time.Traditional and modern methods – The method to be used depends on the width ofthe section being surveyed, its depth, the reservoir size, available resources and otherfactors. It ranges from simple methods, using tape measure and ruler, to sophisticatedmethods, using DGPS. Table 11.2 presents a summary on the methods.Table 11.2 – Methods used for topo-bathymetric surveys in rivers and reservoirsMethodUseDistance measurement Depth measurementTape measure Ruler, graduated scale Rivers or narrow andplain lake channelsWire rope Probe or ballast Rivers or narrow andplain or deep lakechannels, width of up to300mSextantProbe or direct reading Rivers or plain or deepechobathymeter lake channels, width ofTeodolites (2 or 3)Distancemeter or totalstationElectronic positioningsystem Trisponder orMotorolaDigital or analogicalechobathymeterDigital or analogicalechobathymeterDigital or analogicalechobathymeterup to 2kmRivers or plain or deeplake channels, width ofup to 2kmCross-sections of up to10km-widthCross-sections of up to50kmDGPS Digital Echobathymeter Cross-sections anddistances of up to 50kmTowfish equipment andpositioningGeophysics (side scansonar)Vertical and lateralscanningNoteFord measurement or upto 2mFord or boatmeasurementTo install baseline at thebank, in such a way asto read angles over 30 oTo install basictopographic line at thebank, in such a way asto read angles over 30 oMay be electronicallyrecorded to be used inplotterMay be electronicallyrecorded to be used inplotterMay be electronicallyrecorded to be used inplotterAllows vertical andlateral survey on thebed, and for settledlayers as well.For works where depth is measured with probe, positioning with sextant or wirerope, the boat must remain still. For works with digital or analogical echobathymeter,the boat moves slowly, from 2 to 5 knots.For positioning works with sextant or teodolite, it is necessary to implement atopographic line on the bank, with leveled and counter-leveled references. For surveyswith distancemeter, the boats may be tied with a high-resolution GPS. The fastening formarks position in the electronic system is performed with the equipment itself; theANEEL – Brazilian Electricity Regulatory Agency / SIH – Hydrologic Studies and Information Department56
Reservoir Sedimentation Assessment Guidelinestations must be “visible” among them, with no obstacle that may hinder transmissionand reception. See Figures 11.1, 11.2, 11.3, 11.4 and 11.5.In any kind of survey, if the reservoir level is under the reference level (namedreduction level) it will be necessary to complement the survey for each section and bankby using terrestrial topography.Currently, DGPS is the most used method and provides the best accuracy forpoints fastening. Records are all electronically, for use in plotter. A fixed GPS is used atthe bank and the DGPS on the boat; this last is connected with the ground one. TheDGPS on ground is connected to three or more satellites. The maximum error for a50km-positioning is 3m (Figure 11.6).Figure 11.1 – Simplified echogram for cross-section surveyFigure 11.2 – Location in depth points measured along a cross-section with sextantPosição = positionReservatório = reservoirPosição do barco no instante de observação com o sextante = position of boat during observation with sextantPontos de visadas na margem com o sextante no barco = observation points at banks with sextant in the boatMarcos de levantamento nas extremidades da linha = survey marks on the line endsBandeira = flagsANEEL – Brazilian Electricity Regulatory Agency / SIH – Hydrologic Studies and Information Department57
Reservoir Sedimentation Assessment GuidelineFigure 11.3 – Location in depth points measured along a cross-section with teodolitesPosição = positionReservatório = reservoirPosição do barco no instante de observação com o teodolito = position of boat during observation with teodoliteMarcos de levantamento nas extremidades da linha = survey marks on the line endsMargem = bankPosição do teodolito = tedolite positionFigure 11.4 – Schedule for survey operation through electronic system(Bruk, 1985)Estação remota de resposta = response remote stationTransmissor = transmitterAntena = antennaEquipamento de controle = control equipmentRelógio = clockEcobatímetro = echobathymeterIndicador de rota = routerGravador = recorderRegistrador de rota = route registerSinal de sonda de profundidade = probe signalANEEL – Brazilian Electricity Regulatory Agency / SIH – Hydrologic Studies and Information Department58
Reservoir Sedimentation Assessment GuidelineFigure 11.5 – Positioning of fixed and mobile stations on the survey electronic systemEstação remota = remote stationBase = basisÁrea de melhor cobertura = best coverage areaSelection of sections to be surveyed – It is intended to densify the sections in order toobtain the suitable accuracy for drawing isobaths on the map with the selected scale. Forsmall reservoirs, it is usually drawn on a sheet containing the whole lake, which canreport a size similar to those maps presented by IBGE or the maximum of 1,0x1,0m. Forlarge reservoirs, maps will be presented in more than one sheet, displaying thearticulation draw. The scale must be suitable for both quality and accuracy required;therefore, according to DHN’s (from the Brazilian Navy) orientation, the sections forthe draws must be 1,0cm far one from another. Table 11.3 presents a guideline.Table 11.3 – Distance of cross-sectionsMap scale Distance betweensections (m)Kind of Reservoir1 : 2.000 20 Small1 : 5.000 50 Medium1 : 10.000 100 Medium to large1 : 20.000 200 Large1: 25 000 250 LargeNoteAllows for drawingsections at every 1,0cmin the mapIf the bed does not report major variations, a greater distance may be adopted,such as 2,0 or 3,0cm between cross-sections in the draw (the map scale is divided by100 to provide such distance). Figures 11.6 e 11.7 present schedules for survey in smalland large reservoirs (Vanoni, 1977).ANEEL – Brazilian Electricity Regulatory Agency / SIH – Hydrologic Studies and Information Department59
Reservoir Sedimentation Assessment GuidelineFigure 11.6 – Schedule for cross-sections to be surveyed for small reservoir (Vanoni,1977)Transversais de montante = upstream transversalsPoligonal básica = basic poligonalContorno do nível do sangradouro de emergência = emergy runoff level contourMarco topográfico = topographic markContorno mais baixo selecionado = selected lower contourTrasnversais de jusante = downstream transversalsFigure 11.7 – Schedule of survey lines for large reservoirs (Vanoni, 1977)Barragem = damAntigo canal do rio = old river channelMáximo nível d’água para o qual o reservatório é levantado = maximum water level for which reservoir is surveyedLinhas de levantamento = survey linesCanal submerso = underwater channelArea de delta do reservatório = reservoir delta areaCanal a montante do reservatório = reservoir upstream channelANEEL – Brazilian Electricity Regulatory Agency / SIH – Hydrologic Studies and Information Department60
Reservoir Sedimentation Assessment Guideline11.4 Survey specificationsSpecification is a requirement for services like this, in order to provide guidancefor the works. Following, it is presented a suggestion on the specification reach sectionwhere sections are more distant one from another, raising a longitudinal line to assist fora more accurate draw of isobathic lines.Topo-bathymetric cross-sections and one longitudinal section must be surveyed;such survey shall be referenced to the reservoir maximum normal water level. Crosssectionswill be distributed from upstream the reservoir backwater area up to nearby thedam, as well as along the river downstream channel. The longitudinal section shall bemade along the old bed up to nearby the dam.Sketches for locating the above mentioned cross-sections and longitudinalsection should be provided.The following items shall be observed for performing these services:• Sections will be selected in such a way as to display, in the selected map, a distanceof 2,0cm. From the backwater area up to the position where the initial deltaformation is considered, sections were selected in order to have a distance of 1.0 cmin the map.• Services will comprise definition of cross-sections, implementation and fastening oflevel references - materialized through geodesic marks required for the survey-,installation and operation of limnimetric rulers, establishment of permanent crosssectionsfor further monitoring, location of points and their bathymetry, collectionand analysis of bed sediment.• Downstream, the sections to be surveyed shall be defined after a review on thebanks erosion conditions. For all cross-sections, level reference shall be installed foruse in further surveys.• The sections indicated on direct tributaries to the reservoir shall be constructed tothe backwater boundary.• Level reference – The geodesic marks for performing the survey and ensuring goodquality for field works, referenced at the reservoir maximum normal level, shall,whenever required, be implemented with known plani-altimetric coordinates. Basicmarks for fastening shall be located nearby the dam and the reservoir, on thealignment of cross-sections. The densification of supporting network shall be madethrough points, materialized in concrete-made marks, identified according to IBGErules in force. The points fastening shall follow parameters compatible with a workregarded as of the first order. For geodesic calculus, the “Reference GeodesicSystem – SAD/69” shall be used.ANEEL – Brazilian Electricity Regulatory Agency / SIH – Hydrologic Studies and Information Department61
Reservoir Sedimentation Assessment Guideline• For all installed level references (RRNN), localization sketches shall be presentedwith all required data for its accurate characterization. Besides that, they must bedully referenced to in the survey maps.• Installation of ruler – Taking into consideration the long distances to be surveyed,and the need for the work to be referenced to the reservoir maximum normal level,the rulers to be installed must be positioned in a proper way, with level referencematerialized nearby it and fastened one to another, mainly altimetrically. During thesurvey, rulers must be read at short intervals - it may be hourly. The number oflimnimetric gaging stations will depend on the distance between the referencestations to be used for the survey.• For all those gaging stations, description cards on installation shall be presented.• Positioning – The positioning for each depth measured shall be satellite -based; it isrecommended to use the DGPS (Differential Global Positioning System). Thatsystem continuously registers the position of the vessel used, through a mobilereceiver and a reference station, located on a known point of the coordinate onground. That set works through data link, thus allowing the station based on groundto send data on positioning correction for the mobile station; therefore, a betteraccuracy is achieved for those coordinates obtained on board. The system shalloperate through the continuous positioning of measured depths, with accuracy of 2to 5,0m and ranging from 50 to 80km.There must be a PC coupled to the system, presenting a pre-established program forarea and lines to be surveyed, containing the space between lines, the direction ofprofiles and the interval between the points examined, according to the mesh. Itshall also allow for the repositioning of the vessel at any profile or position asrequired, being dully displayed at the computer screen.• Bathymetry – For the bathymetric survey, a good digital echobathymeter must beused, with a 208 kHz-transductor, or similar, capable of providing permanent anddetailed records on the bed high resolution topography for defining the watersedimentinterface, in such a way as to operate in very deep waters. Theechobathymeter must be daily calibrated, by the beginning and by the end of works,through suspended card process, for purposes of correcting sound velocity andprecisely defining depths.The echobathymeter shall be coupled to the mobile receiver and to the computerthrough a program that allows for the automated and simultaneous record of depths,as well as their positioning, in magnetic means (diskette) for further processing.If the water level is lower than the reference level, banks must be leveled - throughtopographic equipment or with GPS - up to the desired level.ANEEL – Brazilian Electricity Regulatory Agency / SIH – Hydrologic Studies and Information Department62
Reservoir Sedimentation Assessment Guideline• Collection and analysis of bed sediment – Aiming at providing subsidies for theadequate estimate on Manning coefficient for backwater studies, a reservoir bedsediment collection shall be performed at every 4 cross-sections, as well as nearbythe dam. Such sampling shall be forwarded to the laboratory for the granulometricanalysis.11.5 Bed mappingThe selected map shall have a scale suitable for the reservoir size; the marksshall be plotted, as well as heights, position of rulers and other data such as topographicleveling line and others.Once having the field cards (work with traditional methods) or the electronicrecords (work with modern techniques) and additional information, the next step is toplot the sections in the map, with the selected scale, and record depths (Figure 11.8).The measured depths must be adjusted based on the rulers reading.ANEEL – Brazilian Electricity Regulatory Agency / SIH – Hydrologic Studies and Information Department63
Reservoir Sedimentation Assessment GuidelineFigure 11.8 – Stream survey using DGPS (Microars, 1996)Having registered all depths for the respective plotted points, the curves on thereservoir bed level – or isobathic – may be traced out, by interpolating depths at every1,0, 2,0 or 5,0m, as allowed by the selected scale.11.6 Computation of reservoir volumesThe survey allows for determining the reservoir capacity that, compared withprevious survey, provides the volume of settled sediment. That capacity is computedthrough two methods, with partial volumes, using either drawn lines or cross-sections.Planimetric methods of bathymetric curves – for this method, it is used to planimeterthe bathymetric curves traced out in the map and, following, make the requiredcomputations to know the reservoir volume between two isobaths. Four processes areused: relation level versus bathymetric areas, average areas, Simpson rule and modifiedprisms (Vanoni, 1977 and Semmelmann, 1981). Other formulas can be seen in Vanoni,1977, e Morris/Fan, 1997.a) The process level versus area uses the following formula:ANEEL – Brazilian Electricity Regulatory Agency / SIH – Hydrologic Studies and Information Department64
Reservoir Sedimentation Assessment GuidelineV = E x A (11.1)the values of which are shown in Figure 11.9 The full line represents the plotting forisobathymetric areas. The dashed area A, between two lines, multiplied by thedistance between them is equivalent to the volume V between two bathymetriccurves. The total volume of the reservoir corresponds to the graph area between thecurve and the levels axis.Figure 11.9 – Relation level x area in the method of bathymetric curves planimetryCota = levelÁrea = areab) The process of average areas calculates reservoir volume by using the average oftwo successive bathymetric curves multiplied by the distance between them:A + BV = xE(11.2)2where A and B are the area of two successive bathymetric curves and E is thedistance between them (Figure 11.10).Figure 11.10 – Process of average areas of bathymetric curvesANEEL – Brazilian Electricity Regulatory Agency / SIH – Hydrologic Studies and Information Department65
Reservoir Sedimentation Assessment Guidelinec) the process using the Simpson rule has the following equation:1V = E[ A0 + An+ 4( A1+ A3+ ... + An− 1) + 2(A2+ A4+ ... + An−2)](11.3)3The condition for applying the Simpson rule is to divide depth into an even numberof bathymetric curves.d) the process of modified prisms, as illustrated in Figure 11.11, uses the followingequation:EV = ( A + A.B + B) (11.4)3Figure 11.11 – Process of modified prisms for calculatinga reservoir capacity (Vanoni, 1977)ANEEL – Brazilian Electricity Regulatory Agency / SIH – Hydrologic Studies and Information Department66
Reservoir Sedimentation Assessment GuidelineMethod of cross-section planimetry – Once the map is available, one shall trace outcross-sections, parallel one to another, for obtaining the respective areas. Thecomputation of reservoir volumes is performed through several processes, three ofwhich are presented below: plotting cross-sections areas versus distance from dam;average of equidistant cross-sections; and Simpson rule.a) the process of plotting cross-sections areas versus distances from dam uses thefollowing equation:V = AxD(11.5)where A is the dashed area between two cross-sections, and D is the distancebetween them. The reservoir total volume corresponds to the graph areas comprisedbetween the curve and the distance axis (Figure 11.12).Figure 11.12 – Cross-sections areas x distance from damÁrea = areaDistância da barragem = distance from damb) the process of average of equidistant cross-section areas relies directly onestablished data and calculates the reservoir volume through the following equation:VD= ( A1+ 2xA2+ 2xA3+ ... + 2xAn − 1+ An) x(11.6)2c) for applying the Simpson rule, it is necessary to divide the reservoir total length inan even number of cross-sections, equidistant one to another and parallel to the dam.The following equation is used:DV = [ A0 + An+ 4( A1+ A3+ ... + An− 1) + 2(A2+ A4+ ... + An−2)](11.7)3ANEEL – Brazilian Electricity Regulatory Agency / SIH – Hydrologic Studies and Information Department67
Reservoir Sedimentation Assessment Guidelinewhere V is the reservoir volume, D is the distance between the sections and A is thecross-sections area.11.7 Computation of settled sediment volumeThe methods presented in item 11.6 refer to the computation of the reservoirremaining volume.Similar computation, using the same equations, is performed by using theprimary or previous survey for comparison purposes, as well as for calculating thesediment volume through the difference between two reservoir volumes for thereservoir.Having the dead storage, the settled volume shall also be computed. Bycalculating the difference to the total volume, one can obtain the volume of sedimentsettled in the useful volume.Those values may also be computed as percentages, in order to review thereduction in the reservoir total volume, the useful volume reduction and to know thetrap efficiency as well.11.8 Outline of new level x area x volume curvesAmong the several results deriving from the survey, the knowledge on thesettled volume and the new reservoir capacity are outstanding.Having the areas of bathymetric curves and corresponding volume summed upto each isobathic being considered, one can trace out the level x area and level x volumecurves. For comparison purposes, the original curves are also traced out.11.9 Pivot pointIt is also important, for the survey, to verify the new geometry of the lake. Forthat, comparative cross-sections are traced out (Figure 11.13), selected from sites alongthe reservoir that may reflect the changes on geometry, concerning its original and newcondition. If there are several surveys available, one shall trace out several sections onthe same position for comparison purposes. The formation of crests, changes on thedelta area and height of sediment settled at the dam base are also surveyed.The longitudinal line for the current thalweg is also traced out for comparing itwith the previous line, intending to obtain the pivot point and its development, whichcharacterizes the delta (Figure 11.14).ANEEL – Brazilian Electricity Regulatory Agency / SIH – Hydrologic Studies and Information Department68
Reservoir Sedimentation Assessment GuidelineFor visualizing the new bed morphology, if the survey is electronically available,it is useful to have software that allows the display of a draw showing the conformationvariation.Figure 11.13 – Comparative cross-sections for reservoir surveys(Carvalho, 1994)N.A. de redução = reduction water levelSituação atual = current situationSituação primitiva = primary situationFigure 11.14 – Longitudinal profiles for reservoir survey, where the pivot point can beobserved (Carvalho, 1994)Altitude = heightAltura de sedimento no pé da barragem = sediment height at the dam basisCone de dejeção = pivot pointDistâncias do talvegue acima da barragem = thalwegue distances above the damANEEL – Brazilian Electricity Regulatory Agency / SIH – Hydrologic Studies and Information Department69
Reservoir Sedimentation Assessment Guideline11.10 Bed scanning and geophysicsThis work is performed by using special equipment. An echobathymeterworking with high-frequency ultrasound allows for emissions that cross the settledlayers, returning to the equipment and recording the changes on thickness (Figure11.15).Figure 11.15 – Seismic recorder, displaying the reservoir bed bottom line and lowerlayers.– UHE Funil/FURNAS, on 02.02.1993 (Conage)Another very useful equipment is the lateral scanning using audiography, whichshows the bed conformation. The equipment is submerged and a sonorous signal is sent,at regular time intervals, through two transductors located on coated water vehicles,named towfish, which carries the side scan sonar. The emission beams are addressed tothe bottom surface sides. Each transductor acts independently, being responsible alsofor receiving the reflected signal. The signals from the bottom surface are recorded asthey are received, on electro-sensitive sheet, therefore making up an image of thebottom of the area being surveyed, named sonogram (Geomap, 1991).12. CONTROL OF A <strong>RESERVOIR</strong> <strong>SEDIMENTATION</strong>Forecast studies and the entire process of sedimentometric measurements aim atverifying the likely reservoir sedimentation and the need for sediment controlling, inorder to mitigate its effects. The sediment control presents several implications forseveral Engineering fields, as a way of protecting works and patrimony involved.Several measurements are complex, since sediment is derived from erosion along thewhole drainage area at the dam site, being hardly accessed by the entity responsible forthe reservoir. Most of the time, only a governmental planning may establish and executea program on erosion control along the whole hydrograph basin.ANEEL – Brazilian Electricity Regulatory Agency / SIH – Hydrologic Studies and Information Department70
Reservoir Sedimentation Assessment GuidelineMany programs on sediment control by the reservoir owners are restricted to itsaction area, where they try to protect river and reservoir banks, in order to diminish theentry of sediments into the system. Programs on reservoir sedimentation prevention arethe most important, and corrective measures are adopted just when there is no otheralternative.12.1 Preventive ControlAccording to CIGB (ICOLD, 1989) the most obvious preventive measure forcontrolling sediments is, most times, disregarded by designers. It regards to the regionsat the rivers headwaters - the upper basin – that have great runoff contribution but smallparcel of bed sediment. It is extremely important to have the forests preserved at thoseregions, so that they do not become responsible for great production of sediments.Summarily, preventive measures may be listed as shown in Table 12.1,following the proper selection of work and reservoir sites, basin erosion control,sediments trap before entering into the fluvial system, and the automatic removal ofsediments. They are used for all stages – inventory, feasibility, project and operation.Table 12.1 – Preventive measures for sediments control andreservoir sedimentationPreventive measuresSelection of reservoir site If there is more than one siteavailable for the dam and reservoirformation, select the onepresenting the lowest allocation ofsedimentsSuitable dead storage forecastForecast on volume set apart forFor the reservoir projectControl of erosion in thebasin(brings several benefits,where the most efficient ishard to be applied by thedam worker; it is necessaryto ask for support fromother entities to managesedimentForecast of sediment dischargerwith gates (for density streams andbed sediment)Soil conservation and managementin agriculture (Bertoni andLombardi Neto, 1990)The site selection depends on financialcosts including protection for the mostdeprived areaIncrease the dam heightIncrease the dam heightPlants far from the dam needs a desanderafter the intakeVegetative practices:- Forestation and reforestation- Grazing grass- Coverage plants- Strip crops- Vegetation beltsPedology practices:- Fire control- Green fertilization- Chemical fertilization- Organic fertilizationANEEL – Brazilian Electricity Regulatory Agency / SIH – Hydrologic Studies and Information Department71
Reservoir Sedimentation Assessment Guidelinethe basin)Control of erosion atwater courses andreservoir banksControl of sedimentaffluence in the flumeControl of sedimentsdeposition12.2 Corrective practicesSediment control on roads, cities,several civil works, control of bothurban and rural erosion;Erosion on the channelFilling in gulliesDams at upstream (may besubmerged, if desired)VegetationBy-pass derivation channelsDeviation of floods for inundationareasDischarger with gate (plannedoperation)Reservoir depletionReservoir planned operationMechanical practices:- Rational distribution of ways- Counter crops- Leveling- Groove and raised bed- Drainage channels- Refrain or protection of taluds- Drainage works- Control of erosion in ravines andgullies- Protection with infusorians vegetation- Structural protection (break-waterconstruction, etc.)Periodically remove the sedimenttrapped- Channel- DuctDecantation basins- Density streams- Bottom sedimentdead storageThere are computer software aimed atsediment accommodationSedimentation corrective practices are performed during the operation stage.Usually, deposits surprise the operator, since they are submerged and increase slowly. Ifthere is no monitoring the surprise happens. It is tried to recover the lost volume withmitigating measures, which are expensive and repetitive. Table 12.2 presents a summaryon corrective practices measures.Table 12.2 – Corrective measures for controlling sediment andreservoir sedimentationRemoval of sediment from thereservoirDam raisingCorrective measuresDredging (the deposition site isimportant)By-pass derivation worksSiphon FilteringBottom dischargerPerform an adequatedimensioningEventualAlmost permanentChannelDuctAt the dam or sometimesremoving farer sediments throughthe bottom dischargerSometimes is must be built afterthe dam is readyWhenever possible, because itwill increase the level and waterbodyANEEL – Brazilian Electricity Regulatory Agency / SIH – Hydrologic Studies and Information Department72
Reservoir Sedimentation Assessment Guideline12.2.1 Discharge of dredged sedimentsThe removal of a reservoir’s sediments by dredging it is expensive. Sometimes,it is cheaper to raise the dam or another solution. Therefore, costs must be reviewed inrelation to the convenience of dredging. Usually, this solution is applied to smallreservoirs to relieve problems caused by deposits in given sites, as for example, at theintake basin.One of the major problems involving dredging is the material settlement.Usually, the dredged material is not economically used because of several costs andother factors, such as sediment pollution or issues concerning the material transportationfor reservoir sources. One could suppose that the coarse settled in the delta area couldbe used for construction, and the fine material closer to the dam, containing nutrientscould be put into agricultural areas. However, in small reservoirs, that natural selectionis not so good and the deposits may have too many impurities, such as waste and others.There is experience enough and suitable solutions for each kind of problemreferring to dredging – width, depth, consolidated sediment, presence of materials suchas stones, gravel, tree trunks and rigorous limitation of disposal – for all cases, (ICOLD,1989).There are several kinds of equipment for removing deposits, which are basicallythe airlift system, the mechanical system (drag-line or clam-shell) and suction anddeposition dredge, using centrifuges pumps to perform the material hydraulicstransportation (Engevix, 1980). Therefore, one must look for the suitable equipment foreach case, allowing greater savings.The disposal of dredged material is a topic involving economic andenvironmental issues. The simple disposal at the reservoir bank, at the area closer to thedredging site, or is thrown at the dam downstream channel, may be an inadequatesolution. For the first case, most of the sediments may come back in short time, duringthe first rains, for the reservoir. For the second case, there will be several problems atdownstream, including channel sedimentation.Many countries have laws regulating water quality, prohibiting the disposal ofdredged material in the stream. Countries as China and Formosa, where sites for dambuilding are scarce, have improved agricultural fields by putting selected materialderiving from dredging, simultaneously recovering the reservoirs’ water storagecapacity. The material may also be used for building marginal dikes to the rivers wherethere is the need for protection against floods (ICOLD, 1989)13. SECONDARY EFFECTS DUE TO SEDIMENTBesides the physical effects deriving from reservoir sedimentation over itsobjective functions, there are several additional secondary impacts that must be taken73ANEEL – Brazilian Electricity Regulatory Agency / SIH – Hydrologic Studies and Information Department
Reservoir Sedimentation Assessment Guidelineinto consideration, and that may expand beyond the reservoir limits and the actuation ofthe responsible company. Such secondary impacts shall be previewed, assessed andconciliated, both during planning, project and construction stage and during thereservoir operation stage (ICOLD,1989).13.1 Effects on the reservoir backwaterThe bed sedimentation in the reservoir entry with delta formation causesdeformations on the river channel which, along time, becomes strangled. The depositsadvance downstream and a little upstream, the channel gradient becomes reduced, whilethe underground water table remains in high level, thus hindering the dredging. Uponthe channel narrowing, as the delta increases, the effects on the reservoir backwater alsoincrease, thus increasing the frequency of floods upstream (ICOLD, 1989).The effects may be analyzed by surveying the formation and expansion of thedelta; however, the study is complex due to reservoir operation, quantity of sedimentaffluence and other factors. The use of HEC-6 model for computation backwater, takinginto consideration the sediment affluence, may display water line profiles for floodsreporting different recurrence times.Delta formation is represented in 13.1, where the top layer, the sliding point, thefront layer and the overbanks are displayed.Figure 13.1 – Typical delta formation: (1) top layer slope,(2) coarse, (3) thalweg original slope, (4) sliding/pivot point,(5) front layer slope,(6) overbanks slope, (7) normal/averageoperation water level, (8) maximum water level, (9) intake,(10) fine sediments (ICOLD, 1989)ANEEL – Brazilian Electricity Regulatory Agency / SIH – Hydrologic Studies and Information Department74
Reservoir Sedimentation Assessment GuidelineFor preliminary evaluations, the delta formation starting point is considered asbeing on the intersection of bed line with the maximum level of the reservoir; and thesliding point (pivot) is on the intersection with average operation level. In this case, thevalue 1.5 of that bed is used for the top layer slope, and for the front layer slope, a valueequivalent to 6,5 times that top layer slope is used. Once having that volume, one maycalculate the formation time for that condition. When the sliding point reaches the dam,the top slope disappears (ICOLD, 1989, and Strand/Pemberton, 1982).13.2 Changes on water qualityThe impacts of sediments on the reservoir and on the quality of downstreamwater have not yet been fully explained or surveyed. Eutrofization is the term applied todescribe the effects and changes on waters confined by the increase on nutrient level,reduction of dissolved oxygen and increase on biologic productivity.The torrents deriving from precipitation carry many types of sediment forstreams and, together with such sediments, nutrients, agro-toxic and whatever thosewaters may carry. Once in the reservoir, those substances undergo several changes andmay, inclusively, affect the downstream water quality. Proliferation of algae and othereffects are consequence of such transformations.13.3 Ecological effectsBoth fauna and flora suffer ecological effects. The deposits in reservoirs modifythe bed quality, thus affecting the life of fishes by changing their natural habitat.Species disappears and only the strong ones survive.The sediment load in water also reduces the penetration of sunlight, thushindering the required transformations for life existing there. On the other hand, the fullremoval of sediments with nutrient, through disposal on the bed, also causes changes. Inanyway, Nature suffers, loosing some species that cannot overcome the changes.Concerning flora, the formation of macrophytes at the reservoir banks, due to thedisposal of fine sediments with nutrients, may be highlighted. Vegetation quicklyspreads and is wrenched by the water level increase and, following, is carried towardsthe dam and intakes.Some vegetal species, upon the fluviometric level raising, may be quicklydisplaced to the lake bottom, thus raising the quantity of flooded terrestrial biomass.Later on, that biomass decomposes through aerobic and anaerobic processes, startingthe process of gas emission to atmosphere, mainly the CH 4 (Methane) that maycontribute to worsen the thermal heating of low terrestrial atmosphere – GreenhouseEffect (UNEP, 1997).75ANEEL – Brazilian Electricity Regulatory Agency / SIH – Hydrologic Studies and Information Department
Reservoir Sedimentation Assessment GuidelineThe natural formation of river beaches provides leisure for riparian population.The effects of the reservoir are felt on those sand banks, both when the lake floods suchareas, making them disappear, and through effects at downstream. Once the reservoir isformed and the sediment is being settled therein, there is no sand feeding atdownstream, thus causing the disappearance of sand banks on that reach. The beacheswill appear just very downstream when the erosion on the downstream incrementalbasin – and the associate transportation of sediment along the stream – allows for theoccurrence of new sand banks, known as sand bars.The effects of the lack of sand provision at downstream are felt up to the outfallof those rivers, and the changes may appear in long-term. This phenomenon may be thereason for the changes occurring at the outfall of Paraíba do Sul and São FranciscoRivers.13.4 Erosion on reservoirs banksThe reservoir banks must be always protected with infusorians vegetation, or byusing conservative practices. Nevertheless, erosions may occur on its banks, be it due towaves impact or due to the high level of drenching during rainy periods, causing the fallof taluds. When that happens nearby the dam, it is necessary an immediate protection.Those sediments will become incorporated to sedimentation, while erosiondevelopment may bring several consequences.13.5 Deposit erosionThe settled sediment may undergo accommodation, slipping into the reservoirbed. When it is settled in the dead storage, it is regarded as benefic. There arecomputational models for reservoir operation using quicker depletion, thus facilitatingthe accommodation process, and enlarging part of the volume occupied by the sediment.However, when sedimentation is closer to the dam, the sliding of deposit maypose risk for its structure or suddenly reach the intake.13.6 Downstream effectsThe sediment trapping in the reservoir causes a runoff of clean water downstream.On the other hand, the regulation of downstream discharges causes major actions overbeds and banks of that channel.Jointly, those two effects – besides others – may cause the deepening of damdownstream channel’s bed and erosion of its banks. For small reservoirs, these areminor effects and may occur at the closest channel, while for large reservoirs thoseeffects are greater and may be felt even hundred kilometers downstream the barrier.ANEEL – Brazilian Electricity Regulatory Agency / SIH – Hydrologic Studies and Information Department76
Reservoir Sedimentation Assessment GuidelineDegradation at the downstream channel may have several undesired consequencesto environment. Structures at the channel, such as bridges or piping crossing the river bythe bed, are subject to lowering that could damage its structural integrity. If the channelbanks are on the stream attack point, valuable agricultural, industrial or residentialproperties may be damaged, unless protective measures are adopted. The biologicalcommunity at the downstream channel may be seriously affected by the increase of thechannel bed’s thicker material and by a change on the vegetation growth along thebanks (ICOLD, 1989).There are several methodologies for forecasting the effects occurring downstreamthe reservoirs (Bruk, 1985). One of them is the HEC-6 model, and there are others thatalso perform computations by applying sediment hydraulics formulas. Simpler methodswere suggested in Strand (1974) and ICOLD (1989) trying to approach the surveythrough the formation of the bed shield, through the transportation of finer material, orthrough the steady slope computation. The items below correspond to a bibliographicalsurvey using bed transformation and mainly based on the two previously mentionedpapers.13.6.1 Channel degradationUsually, the river natural runoff carrying sediment is in a quasi-equilibriumregime, with no long-term tendency for sedimentation or degradation. That equilibriumregime may be expressed by equation 13.1 (see Figure 13.2)QDs= kQS(13.1)where:Q s = sediment dischargeD = Particle diameterQ = Net dischargeS = Channel slopek = Proportionality constantANEEL – Brazilian Electricity Regulatory Agency / SIH – Hydrologic Studies and Information Department77
Reservoir Sedimentation Assessment GuidelineFigure 13.2 – Relation among factors contributing to the establishment of a steadyequilibrium in a river channel, according to Lane (WMO, 1981).Granulometria = granulometryPlano íngrime = sloped planAlta degradação = high degradationAlta agradação = high aggradationCarga sólida = sedimentVazão = runoffDiámetro da partícula = particle diameterDeclividade do leito x vazão = bed x runoff slopeIf one of the four variables is altered, one or more of the remaining shall undergochanges in order to return the channel back to the equilibrium status. Therefore, thereduction of the dam slope at downstream may be foreseen if changes occur. If there isenough coarse, then fine particles may be carried and the thick material is trapped.Those processes resulting into the removal of bed and bank sediment particles areknown as degradation (Strand, 1974).The degradation process gradually moves towards downstream, until it reaches asite where the sediment being carried results in a stable channel, or in equilibrium. Anyamount of coarse passing through the dam shall have a compensation effect over thechannel degradation.There are two different ways for estimating the height or quantity of degradationthat may occur downstream, or in a similar structure, each of them depending on thekind of material making up the river channel bed.When there is enough thicker material or material reporting greater granulometry -that cannot be carried by the river normal discharges –on the bed, a protective layer willbe developed as finer material is displaced and carried downstream. A verticaldegradation shall occur in a value progressively slower, until a shield stands in such aheight as to inhibit greater degradation. However, if the bed is made up by material thatANEEL – Brazilian Electricity Regulatory Agency / SIH – Hydrologic Studies and Information Department78
Reservoir Sedimentation Assessment Guidelinemay be transported, and the material moves towards waters deeper than those where thechannel may become degraded, so the channel will change its slope until it reaches asteady slope, which will be computed together with the expected degradation volume.(Strand, 1974).The determination of the channel main discharge and features are a requisite forthose estimates.13.6.2 Main dischargeThe main discharge is defined as the discharge that, if a constant runoff occurred,it should have the same effect all over the channel shape, such as would be the unsteadynatural discharge. The main discharge used for surveys on channel stabilization isusually considered as the overflowing discharge, or peak discharge, reporting anoccurrence interval of about two years for a non-monitored river (Strand, 1974).By regulating the discharge through an upstream dam, the problem becomes morecomplex at the downstream channel, since data required for further discharge by thedam would be no longer available. If the reservoir runoff is almost uniform and flooddischarges are relatively rare, the daily average discharge may be used as the maindischarge. However, if the runoff is subject to a considerable variation due to floods, thepeak discharge that is equivalent to or exceed the average once at every two yearswould be considered as the main discharge (Strand, 1974).13.6.3 Channel hydraulic featuresThe next step for calculating the degradation at a dam’s downstream channel isthe determination of hydraulic characteristics for the main discharge nearby the channel.Usually, those data may be obtained from the survey on the discharge tributary to thereservoir backwater. The features of all backwater cross-sections, when draining themain discharge, are proportionally divided in order to reach a cross-section that mayrepresent the channel degradation. The water surface slope may be considered asequivalent to the hydraulic gradient (Strand, 1974).13.6.4 Method of degradation constrained by the shieldThe first procedure to be tested for calculating the degradation downstream is themethod of shield formation review. This method is specially applicable if there areenough big stones or thick material – that cannot be carried by the normal riverdischarge – on the bed, in such a quantity as to build up a shield layer (ICOLD, 1989).During shield building process, the finer material transportable is removed, anddegradation takes place in a progressively lower index, until a shield high enough tohold back a greater degradation is built. Usually, a shield layer may be foreseen if there79ANEEL – Brazilian Electricity Regulatory Agency / SIH – Hydrologic Studies and Information Department
Reservoir Sedimentation Assessment Guidelineis about 10% or more of bed material reporting the same diameter of the shield, orgreater. The shield computations suppose that a coarse layer will be built, as shown inFigure 13.3.y = height of original bed at the bottom of the shield layery a = degradation height or thickness of shield layerD c = diameter of the material building up the shieldy d = height of original bed at the top of the shield layer or degradation heightFigure 13.3 – Schedule for defining the shield (ICOLD, 1989)NA = Water levelEscoamento = runoffLeito original = original bedMaterial original do leito = original bed materialLeito degradado = sedimented bedFrom the figure, one may deduce that:y y ya= − d(13.2)By default:( )ya = Δ p y(13.3)where,Δp = percentage of material with diameter greater than the shield thicknessdiameter.Matching both equations, the degradation height is equivalent to:yd⎛ 1 ⎞= ya⎜−1⎟⎝ Δp⎠(13.4)The thickness of shield y a shall vary according to the particle diameter; however itis usually adopted as equivalent to 3 times the diameter D c of the shield particle, or15cm (0,5ft), or a little smaller.ANEEL – Brazilian Electricity Regulatory Agency / SIH – Hydrologic Studies and Information Department80
Reservoir Sedimentation Assessment GuidelineThe average diameter for the sediment particles required for building the shieldmight be computed through several methods, being one considered as the verification ofthe other. Each method shall report a different shield diameter, thus requiringexperience when evaluating the most suitable option. Basic data for computationsrequire:• sampling of bed material along the reach being surveyed, as well as in differentheights along the entire zone where degradation may occur;• selection of the main discharge, usually adopted as the discharge peak with twoyears of recurrence;• channel’s average hydraulics features corresponding to the selected main discharge,obtained from the computation of uniform backwater runoff throughout the selectedriver reach.Following, are presented four methods for computing the diameter D c .Use of the bed capable velocity – Several laboratory surveys have evidenced that thediameter of a particle taken from bed is proportional to the velocity of the stream nearbythe bed. The velocity in which the particle starts its movement is considered as the bedcapable velocity, V b , which was observed to be approximately equivalent to 0,7 timesthe average velocity for the channel V m :V b = 0,7 V m (13.5)Figure 13.4 represents the bed capable velocity V b in relation to the diameter of amobile sediment particle, and has been used to determine the shield thickness.Figure 13.4 – Bed capable velocity in relation to the average diameter of thetransportable sediment (Strand, 1974)ANEEL – Brazilian Electricity Regulatory Agency / SIH – Hydrologic Studies and Information Department81
Reservoir Sedimentation Assessment GuidelineVelocidade de fundo = bottom velocityVelocidade capaz do leito = bed capable velocityVelocidade média = average velocityDiâmetro de partículas = particles diameterUse of tractive power – Tractive power, or shearing strength, is the tension acting overthe channel bed wet area, and may be expressed as:τ = γpS (13.6)where,τ = tractive power ( kg/m 2 or lb/ft 2 )γ = water specific weight ( kg/m 3 or 62,4 lb/ft 3 )p = average depth (m or ft)S = hydraulics gradientWhen the tractive power is computed for main discharge, the curves for tractivepower presented in Figure 13.5 may be used in order to determine the average diameterof the the bed material shield thickness diameter.ANEEL – Brazilian Electricity Regulatory Agency / SIH – Hydrologic Studies and Information Department82
Reservoir Sedimentation Assessment GuidelineFigure 13.5 – Tractive power in relation to the transportable sediments diameter(Strand, 1974)Linha de força gradual = gradual tension lineForça gradual = gradual tensionValor recomendado para canais com alta concentração de finos = value recommended for channels with high concentration of finematerialRecomendado para canais com areia fina com água contendo colóides = recommended for channels with fine sand with watercontaining colloidsRecomendado para canais com areia = recommended for channels with sandValores recomendados para canais com baixa concentração de finos = values recommended for channels with low concentration offine materialValores recomendados para canais com mat. não coesivos = values recommended for channels with non-cohesive materialValores recomendados para águas claras = values recommended for clear waterValores de Straub de força trativa crítica = Straub values for critical tractive powerRecomendado para canais de areia fina e águas claras = recommed for channels with fine sand and clear watersForça trativa crítica = critical tractive powerUse of Meyer-Peter & Muller equation – The Meyer-Peter & Muller equation for nullsediment discharge is expressed by:S =Q019Q⎛ n⎜⎝ Ds,16 /B 90p⎞⎟⎠3/2D(13.7)where,Q = total net discharge (ft 3 /s)Q B = part of the net discharge influencing the bed (ft 3 /s)n s = Manning roughness coefficient for the total sectionD 90 = diameter of the particle for which 90% of bed sediment is lower (mm)p = average channel depth (ft)D = minimum average diameter transportable present in the bed material (mm)Based on that equation, D may be computed and, afterwards, the shield thickness.Therefore, from Meyer-Peter & Muller equation, considering Q/Q b = 1:526 , SpD= Dc=⎛ n ⎞s⎜ ⎟16 /⎝ D ⎠903/2(13.8)Use of Schoklitsch equation - Schoklitsch equation for null sediment discharge has thefollowing expression:3/4DBS = ⎛ ⎝ ⎜ 0,00021 ⎞⎟Q ⎠where B is the channel width (ft).(13.9)Evidencing the value of D for the equation, we have:ANEEL – Brazilian Electricity Regulatory Agency / SIH – Hydrologic Studies and Information Department83
Reservoir Sedimentation Assessment GuidelineD= D =c434762S/ QB(13.10)13.6.5 Method of degradation constrained by steady slopeThe method for calculating the steady slope - in order to define the downstreamdegradation - is used when there is not enough coarse for building a shield layer. Themethod is used when the main purpose is to calculate the height of downstream bederosion, for the work project; it may result in the indication of protective measures atdownstream, in order to avoid diggings on the bed. It is also used for previous planningon levels with small amount of field data, and when the costs for a more detailed surveyare extremely high (ICOLD, 1989).The steady channel method is illustrated in the Figure 13.6 schedule. The steadyslope is defined as the river slope where bed material can no longer be transported.S b = natural bed slopeS L = threshold or stable slopeFigure 13.6 – Typical schedule of degraded channel using the triple slope method(ICOLD, 1989)As shown in Figure 13.6, the process is also defined as the triple slope methodbecause this is the expected variation on total slope, concerning steady slope and theslope existing a little farther at downstream. The computations for steady channel maybe performed by applying several methods, such as:ANEEL – Brazilian Electricity Regulatory Agency / SIH – Hydrologic Studies and Information Department84
Reservoir Sedimentation Assessment Guideline• Meyer-Peter & Muller equation for bed load, expression 13.7, for the beginning ofthe transportation;• Schoklitsch equation for bed load, expression 13.9, for null sediment transportation;• Shield graph for no movement or no displacement of particles;• Lane relations for critical tractive power, presuming a clean water runoff inchannels.The discharge to be used for any of the above-mentioned methods is the maindischarge, and it is also necessary to have hydraulics features determined.Besides the restraints or steady slope for the degraded channel, it is also necessaryto determine the volume of material that may be removed from the channel. If there isno control downstream in order to restrain degradation, sometimes, one may supposethat the river will report a coarse load (> 0,0625 mm) equivalent to that share ofhistorical load concerning the same granulometric band. It necessarily assumes littledepletion in discharge amount and less regulation at upstream. If the discharge isdrained or regulated, the sediment load to occur will be lesser than historical load, andthe due adjustment on that load shall be made (ICOLD, 1989).Once established the steady slope and the volume of the material that may beremoved, the degradation height nearby the dam, and the degraded channel profile aswell, may be estimated if the following assumptions are reasonably met:• The degraded reach is uniform enough to allow for the use of average cross-sectionand average slope along its full extension;• The bed and bank material, along the entire channel, are similar enough in order toallow for the use of an average composition, and to ensure that there are no nonerodibleobstacles, either at bed or banks, for avoiding the stream to reach theaverage steady section at the steady slope;• Degradation is such that the vertical component will prevail and horizontalmovement will be restricted to the small layer on the bank, resulting from verticaldegradation.Experiments have proved that a degraded stream course profile may berepresented by a typical schedule equivalent to three times the slope, as presented inFigure 13.6 (ICOLD, 1989).There are several ways for determining the volume of the material to be removedby using the steady slope method. The volume may be visualized from the figure, asfollows:V = A T × B (13.11)where,V = volume of material to be degraded (m 3 )A T = longitudinal degradation area (m 2 )B = width of degraded channel (m)ANEEL – Brazilian Electricity Regulatory Agency / SIH – Hydrologic Studies and Information Department85
Reservoir Sedimentation Assessment GuidelineIf there is no control at downstream or no limiations for length L for degradation,the two ways for calculating the volume are (ICOLD, 1989):• To presume that the river will remove a coarse load (> 0,062 mm) equivalent to thequantity of historical sediment load > 0,062 mm;• To calculate the influenge at the degraded reach by using sediment rating curve andthe discharges permanence method, or any other method.For the second case, the sediment rating curve may be defined by using one ormore of the bed sediment formulas, and the reservoir influenge permanence formula.Evidencing A T for the previous equation (13.11):VAT = (metrical system) (13.12)BOnce computed the value for A T , the degradation height may be determinedthrough the following equation:where:D =⎛⎜⎝64 × AT× ΔS⎞⎟39 ⎠1 2ΔS = the difference between the existing and the steady slope(13.14)The degraded reach length may be computed through:13 × DL =8 × ΔS(13.15)If any lateral degradation foreseen for the river - caused by erosion on the bank –is regarded as a significant factor, a complementary survey shall be required in order todetermine the width of the degraded channel. The amplitude of vertical degradation isnot necessarily so high, because a portion of the material will come from banks. Lateralmovement shall always be assessed when banks are made up by the same material asthe bed, and there is not enough vegetation to hold the material.If there is a permanent control at any point of the degradation reach, equation13.14 may be used to directly solve the degradation height issue (ICOLD, 1989).13.7 Reservoir surveys supported by satellite imagerySatellite imageries are used either isolated or compared to previous imageries.Landsat TM imageries are especially suitable for performing works aimed at analysisreferring to reservoirs sedimentation; development of aquatic vegetation and in erosiveANEEL – Brazilian Electricity Regulatory Agency / SIH – Hydrologic Studies and Information Department86
Reservoir Sedimentation Assessment Guidelineprocesses along the reservoir banks and downstream channel. Those products are usefulfor identifying the features through imageries interpretation. They may also be usefulfor guiding field works. Such imageries are periodically obtained by the satellite, thusallowing comparison and analysis aiming at the dynamics of geomorphological andfluvial processes and, therefore, their trends.ANEEL – Brazilian Electricity Regulatory Agency / SIH – Hydrologic Studies and Information Department87
Reservoir Sedimentation Assessment Guideline(A)(B)Figure 13.7 – (A) Landsat Imagery covering part of Tucuruí reservoir – Water tonesrepresented by bluer colors correspond to the areas reporting greater percentage ofsuspended material than the darker tones. (B) –Landsat TM Imagery illustrating theprocess of aquatic vegetation development at a branch of Tucuruí reservoir withintensive agricultural and cattle raising use, nearby it (picture of the work performed byEletronorte).The interpretation of Landsat TM imageries are digitally processed and analyzedjointly with data on level curves obtained from existing cartographic material andthematic maps issued by project Radam.13.8 Erosion control at downstream channelThe downstream channel erosion may advance towards upstream and damagethe dam, even though dams are always planned taking into consideration suchpossibility. However, works at downstream, such as bridges, marginal dams and intakesmay be affected by the erosion on the river channel. Table 13.1 shows the preventiveand corrective measures to be adopted.Preventive measures(Studies during the project stage)Corrective measuresTable 13.1 – Erosion control at the downstream channel -Preventive and corrective measuresArmoringChange on slopeBuilding a rocky sea-wallStructural worksTo review, through models, ifthick bed sediment is enough forprotective purposesTo review, through models, ifslope will not change beyond agiven limitANEEL – Brazilian Electricity Regulatory Agency / SIH – Hydrologic Studies and Information Department88
Reservoir Sedimentation Assessment GuidelineBIBLIOGRAPHY (consulted and complementary)Note: Not all the bibliography below was referred to in the ReservoirsSedimentation Evaluation Guide• ABRH, Associação Brasileira de Recursos Hídricos (Brazilian Water ResourcesAssociation) (1991). Carta de Ouro Preto. I National Meeting on SedimentsEngineering. Sediments Engineering Commission. Ouro Preto, MG• ABRH, Associação Brasileira de Recursos Hídricos (1996). Produção desedimentos. II National Meeting on Sediments Engineering. Sediments EngineeringCommission. Rio de Janeiro, RJ.• ABRH, Associação Brasileira de Recursos Hídricos (1998). Assoreamento dereservatório e erosão à montante. III National Meeting on Sediments Engineering.Sediments Engineering Commission. Rio de Janeiro, RJ.• AGRICULTURE, COMMERCE, DEFENSE, INTERIOR DEPARTMENTS,Independent Agencies Working Group: Work Group 3 on Sediment (1978).National handbook of recommended methods for water-data acquisition sediment.Washington, DC.• ALMEIDA, Sérgio Barbosa, and CARVALHO, Newton de Oliveira (1993). Efeitosdo assoreamento de reservatórios na geração de energia elétrica: análise da UHEMascarenhas, ES. X Brazilian Symposium on Water Resources and I Symposiumon Water Resources of the South Cone. Gramado, RS.• AMARAL, Nautir David (1981). Noções de conservação do solo. 2 nd Edition.Nobel. São Paulo, SP.• ANNANDALE, G. W. (1987). Reservoir sedimentation. Elsevier Science PublishersB. V. Amsterdam.• BARROS, Wanderbilt Duarte de (1956). A erosão no Brasil. Ministry of PublicTransportation and Civil Works. Rio de Janeiro, RJ.• BENSON, M.A., DALRYMPLE, Tate (1968). General field and office procedurefor indirect discharge measurements. US Geological Survey – Book 3: Chapter A1.Washington, DC.• BERTONI, José, and LOMBARDI NETO, Francisco (1990). Conservação do solo.Ícone. São Paulo, SP.• BOGARDI, János (1974). Sediment transport in alluvial streams. Akadémiai Kiadó.Budapest, Hungary.• BRUK, Stevan (1985). Methods of computing sedimentation in lakes and reservoirs.UNESCO, IHP - II Project A.2.6.1. Paris.• BURKHAM, D.E. (1985). An approach for appraising the accuracy of suspendedsedimentdata. US Geological Survey Professional Paper 1333. Washington, DC.• CARVALHO, Newton de Oliveira (1981). Cálculo da descarga sólida total pelométodo de Colby. IV Brazilian Symposium on Hydrology and Water Resources.Fortaleza, CE.• CARVALHO, Newton de Oliveira (1982). Sedimentologia. Text book for theCourse on Dams Safety. ELETROBRÁS. Itaipava, RJ.ANEEL – Brazilian Electricity Regulatory Agency / SIH – Hydrologic Studies and Information Department89
Reservoir Sedimentation Assessment Guideline• CARVALHO, Newton de Oliveira (1984). Cálculo da descarga sólida total pelométodo modificado de Einstein – adaptação ao sistema métrico. Unpublished. Riode Janeiro.• CARVALHO, Newton de Oliveira (1986). Aplicação do método modificado deEinstein para cálculo da descarga sólida total no sistema métrico – cálculo de Z’segundo Lara. Unpublished. Rio de Janeiro.• CARVALHO, Newton de Oliveira, and LOU, Wellington Coimbra (1990).Evaluation of the useful life of a reservoir on the river Manso. Mato Grosso State,Brazil: a case study. IAHS Publication No.197. The Hydrological Basis for WaterResources Management – proceedings. Beijing, China.• CARVALHO, Newton de Oliveira (1991). Cálculo do assoreamento e da vida útilde um reservatório na fase de estudos de inventário. IX Brazilian Symposium onWater Resources and V Portuguese/Brazilian Symposium on Hydraulics and WaterResources. Rio de Janeiro, RJ.• CARVALHO, Newton de Oliveira, and CATHARINO, Márcio Gomes, andPRODANOFF, Jorge Henrique Alves (1991). Curvas de transporte de sedimentos.IX Brazilian Symposium on Water Resources and V Portuguese/BrazilianSymposium on Hydraulics and Water Resources. Rio de Janeiro, RJ.• CARVALHO, Newton de Oliveira, and CATHARINO, Márcio Gomes, andPRODANOFF, Jorge Henrique Alves (1991). Avaliação do assoreamento doreservatório da UHE Itaipu, PR, relatório preliminar. ELETROBRÁS.Unpublished. Rio de Janeiro, RJ.• CARVALHO, Newton de Oliveira (1994). Erosão crescente na bacia do rioDoradas (Estado de Tachira, Venezuela). FURNAS/ELETROBRÁS/CADAFE. Riode Janeiro, RJ• CARVALHO, Newton de Oliveira (1994). Hidrossedimentologia Prática. CPRM,ELETROBRÁS. Rio de Janeiro, RJ.• CARVALHO, N.O. (1998). Assoreamento e proteção de reservatórios. V NationalSymposium on Erosion Control. ABGE. Presidente Prudente, SP.• CARVALHO, Newton de O., GUILHON, Luiz G. e TRINDADE, Pedro A. (2000).O assoreamento de um pequeno reservatório - Itiquira, um estudo de caso. RBRH,Revista Brasileira de Recursos Hídricos, Volume 5, n. 1. Jan/Mar 2000, 68-79.Porto Alegre, RS.• CARVALHO, N.O., GUILHON, L.G. e TRINDADE, P.A. (2000). O assoreamentode pequeno reservatório devido efeito de enchente extraordinária – Itiquira, umestudo de caso. I Symposium of Water Resources of the Middle West Region.ABRH, UnB, ANEEL et al. Brasilia, DF.• CEEE, Companhia de Energia Elétrica do Estado (State Electric Power Facility)(1958). Estudo sobre o transporte sólido – Rio Camaquã. Hydrology Section. PortoAlegre, RS.• CEMIG (1965). Manual de Hidrometria - Sedimentometria. Hydrology Division.Belo Horizonte.• CHILDERS Jr, Dallas (1969). Hydrology training manual. Number 3 - Collection ofbasic sediment data. Ministry of Agriculture. Royal Government of Afghanistan.Kabul.ANEEL – Brazilian Electricity Regulatory Agency / SIH – Hydrologic Studies and Information Department90
Reservoir Sedimentation Assessment Guideline• COLBY, B.R., e HEMBREE, C.H. (1955). Computations of total sedimentdischarge: Niobrara river near Cody, Nebraska. US Geological Survey. Water-Supply Paper 1357. Washington, DC.• COLBY, B.R., e HUBBELL, D.W. (1961). Simplified methods for computing totalsediment discharge with the modified Einstein procedure. USGS Water-SupplyPaper 1593. Washington, DC.• COLBY, Bruce R. (1963). Fluvial sediments - a summary of source, transportation,deposition, and measurement of sediment discharge. USGS, Bulletin 1181-A.Washington, DC.• COLBY, B.R. (1964). Discharge of sands and mean-velocity relationships in sandbedstreams. US Geological Survey, Professional Paper 462-A. Washington, DC.• CORPS OF ENGINEERS (1961). Reservoir sedimentation investigation program.Manual EM 1110-2-4000. USA.• CPRM, Companhia de Pesquisa de Recursos Minerais (Mineral Resources SurveyCompany) (1976). Recomendações para os trabalhos de sedimentometria. BeloHorizonte.• CUNHA, L. Veiga da (1968). Avaliação do caudal sólido em escoamentosunidirecionais. National Civil Engineer Laboratory. Lisboa.• DEJIA, Zhou & DAORONI, Liu, & HAOCHUAN, Gao (1981). The development ofa sand bed load sampler for the Yangtze River. Proceedings of the FlorenceSymposium, IAHS Publ. No. 133. Florence, Italy.• DNAEE, Departamento Nacional de Águas e Energia Elétrica (National Departmenton Water and Electric Power) (1970). Normas e Recomendações Hidrológicas.Ministry of Mines and Energy. Brazil.• DNAEE, Departamento Nacional de Águas e Energia Elétrica (1977). Manual paraserviços de hidrometria. Ministry of Mines and Energy. Brazil.• DNAEE/CESP/ELETROBRÁS (1985). Técnica de acompanhamento dodeslocamento das dunas. Course on the study of load transportation along streamsand sedimentation of multiple-use reservoir. Ilha Solteira, SP.• DNAEE, Departamento Nacional de Águas e Energia Elétrica (1996). Inventáriodas estações fluviométricas. Brasilia.• EDWARDS, Thomas K. & GLYSSON, G. Douglas (1988). Field methods formeasurement of fluvial sediment. Open-file report 86-531. USGS. Reston, Virginia.• EINSTEIN, Hans Albert. 1950. The Bed load function for sediment transportationin open channel flows. US Department of Agriculture. Soil Conservation Service.Technical Bulletin no. 1026. Washington, DC.• ELETROBRÁS, Centrais Elétricas Brasileiras (Brazilian Electric Power Units)(1991). Diagnóstico das condições sedimentológicas dos principais rios brasileiros.IPH/UFRGS Report. Rio de Janeiro, RJ.• ENGEVIX S.A. (1980). UHE Mascarenhas – Assoreamento da tomada d’água –Análise do problema e indicação de soluções imediatas. Report for Escelsa. Rio deJaneiro, RJ.• FREIRE, Octávio, and VIZEU, Luiz Antônio S. (1985). Curso sobre estudo detransporte sólido nos cursos d’água e assoreamento de reservatório de usomúltiplo. DNAEE/CESP/ELETROBRÁS. Ilha Solteira, SP.ANEEL – Brazilian Electricity Regulatory Agency / SIH – Hydrologic Studies and Information Department91
Reservoir Sedimentation Assessment Guideline• GEOMAP, Estudos Ambientais (1991). Catálogo. Rio de Janeiro, RJ.• GLYSSON, G. Douglas (1987). Sediment-transport curves. US Geological Survey,Open-file Report 87-218. Reston, VA.• GUY, Harold P. & NORMAN, Vernon W. (1970). Field methods for measurementof fluvial sediment. Book 3. Chapter C2. USGS. Washington, DC.• GUY, Harold P. (1969). Laboratory theory and methods for sediment analysis. Book5. Chapter C1. USGS. Washington, DC.• GUY, Harold P. and NORMAN, Vernon W. (1970). Field methods formeasurement of fluvial sediment. Book 3, Applications of Hydraulics. USGS.Washington, DC.• HADLEY, R.F., and LAL, R., and ONSTAD, C.A., and WALLING D.E., andYAIR, A. (1985). Recent developments in erosion and sediment yield studies.UNESCO. Paris.• HUBBELL, D. W. (1964). Apparatus and techniques for measuring bedload. USGeological Survey, WSP 1748. Washington, DC.• IAHS/AISH, International Association of Hydrological Sciences (1981). Erosionand sediment transport measurements. Proceedings of the Florence Symposium 22-26 June 1981. Florence, Italy• ICOLD, International Commission on Large Dams (1989). Sedimentation control ofreservoirs/Maîtrise de l'alluvionnement des retenues. Committee on Sedimentationof Reservoirs. Paris.• IPEN, GEA (1987). Determinação da descarga sólida por arrasto de fundo no rioParaná (Guaíra, PR) com utilização de traçador radioativo. Unpublished. SãoPaulo, SP• IPT, Instituto de Pesquisas Tecnológicas do Estado de São Paulo (São Paulo StateTechnological Surveys Institute) (1980). Levantamento e prognóstico a respeito deassoreamento das barragens de Passo Real e Ernestina (RS) e Capivari (PR):avaliação do assoreamento. Report to ELETROBRÁS. São Paulo, SP• ISO (1985). Sand fluxmeter, standard version. ISO/TC 113/SC-N198. Wallingford,UK.• ISO (1977). Liquid flow measurement in open channels. Bed material sampling.ISO 4364. Wallingford, UK.• JULIEN, Pierre Y. (1995). Erosion and Sedimentation. Cambridge University Press.Cambridge, UK.• LARA, J.M. (1966). Computation of Z’s for use in the modified Einstein procedure.USBR. Denver, CO• LEINZ, Viktor, and LEONARDOS, Othon Henry (1977). Glossário Geológico. 2 ndEdition. Companhia Editora Nacional. São Paulo, SP.• LELIAVSKY, Serge (1964). Introducción a la hidráulica fluvial. Ediciones OmegaS.A. Barcelona.• MAHMOOD, Khalid, e PONCE, V. Miguel (1975). Computer program forsediment transport. Colorado State University. Fort Collins, CO.• MAHMOOD, K. (1987). Reservoir sedimentation – impact, extent and mitigation.World Bank Tech. Paper No. 71. Washington, DC.ANEEL – Brazilian Electricity Regulatory Agency / SIH – Hydrologic Studies and Information Department92
Reservoir Sedimentation Assessment Guideline• MILLER, Carl R. (1951). Analysis of flow-duration, sediment-rating curve methodof computing sediment yield. US Bureau of Reclamation. Denver, CO.• MINARD, Paulo Sérgio P., e SALIM, Lécio Hannar (1985). Medição in situ deconcentração e densidade de sedimentos por métodos nucleares. Seminar on the useof Radioactive Tracers in Hydraulics and Sedimentology. Nuclebrás. BeloHorizonte, MG.• MORRIS, Gregory L. & FAN, Jiahua (1997). Reservoir sedimentation handbook.McGraw-Hill. New York.• NORDIN, Carl F. (1981). Instructions for use of the 3-liter and 8-liter collapsiblebag sampler. Lakewood, CO, USGS.• OEA/PLANVASF (1986). Diagnóstico sedimentológico da bacia do São Francisco.Technical Report RTP-86/23, unpublished, by Newton de Oliveira Carvalho.Brasilia, DF.• OTTONI NETTO, Theophilo B.O., and LOMBARDI, Paulo C., and OTTONI,Arthur B. (1989). Caracterização do grau de assoreamento e da curva de eficiênciade retenção do reservatório Soledade. Aço-Minas. Ouro Preto, MG.• PAIVA, João Batista de (1988). Avaliação de modelos matemáticos de cálculo detransporte de sedimentos em rios. São Carlos Engineering School. Doctorate Thesis.São Carlos, SP.• LAGO, Nilson, and PAIVA, João Batista Dias de (1995). TSR 1.0 – Software paracálculo do transporte de sedimentos em rios – Manual do usuário. Santa MariaFederal University. Santa Maria, RS.• PERKINS, Don C., and CULBERTSON, J.R. (1970). Hydrograph andsedimentation survey of Kajakai reservoir. Afghanistan. USGS. Washington, DC.• PONTES, Amauri Beltrão (1977). Controle de erosão na região noroeste do estadodo Paraná. Brasil. DNOS. Curitiba, PR• PORTERFIELD, George (1972). Computation of fluvial sediment discharge.Techniques of water resources investigation of the USGS. Washington, DC.• RINGEN, Bruce H. (1978). Representative sampling of water-sediment mixtures.USA.• RIQUIER, J. (1982). Evaluation globale de la dégradation des soils. Nature etRessources v. 18 n. 2. Unesco. Paris.• ROCHA, João S. (1980). Assoreamento de pequenas albufeiras associadas acentrais elétricas de muito pequena potência. LNEC. Lisboa.• ROCHA, João S., and FERREIRA, J.P. Carcomo Lobo (1980). A erosão hídrica nabacia do rio Guadiana e o assoreamento da albufeira de Alqueva. National CivilEngineering Laboratory (Memorial n o 541). Lisboa.• SCHAAFSMA, A.S. and DER KINDEREN, W.J.G.J. (1985). Ultrasonicinstruments for the continuous measurement of suspended sand transport.Hydraulics Laboratory. Delft.• SCS (1971). Sedimentation National Engineering Handbook. US Department ofAgriculture. Washington, DC.• SEMMELMANN, Franz Rainer (1981). Sedimentometria. Course for an AgreementELETROBRÁS/UFRGS/IPH. Porto Alegre, RS.ANEEL – Brazilian Electricity Regulatory Agency / SIH – Hydrologic Studies and Information Department93
Reservoir Sedimentation Assessment Guideline• SEPLAN/CNPq (1982). Ação programada em ciências e tecnologia: recursosnaturais hídricos. III PBDCT. Brasilia, DF.• SEREBRENICK, Roberto, and CARVALHO, Newton de Oliveira (1966).Definições, finalidade, estabelecimento e aplicações da técnica do hidrogramaunitário para uma bacia hidrográfica. Descarga sólida: estudo e exemplificação emrios brasileiros. DNAEE. Rio de Janeiro.• SEREBRENICK, Roberto, e CARVALHO, Newton de Oliveira (1970). Guiaprático para estabelecimento de uma curva-chave. Vida útil dos reservatórios.DNAEE. Rio de Janeiro.• SHEN, Hsieh Wen (1972). Sedimentation. Symposium to Honor Professor H. A.Einstein. Colorado State University. Fort Collins, CO.• SHEPPARD, John R. (1960). Investigation of Meyer-Peter and Muller formulas.USBR. Denver, CO.• SIMONS, Daryl B & SENTURK, Fuat (1977). Sediment transport technology.Colorado State University. Fort Collins, CO.• SLOFF, C. J. (1997). Sedimentation in reservoir. Communications on Hydraulicand Geotechnical Engineering. Faculty of Civil Engineering. Delft.• STEVENS Jr., Herbert H. & HUBBELL, David H. (1986). Computer programs forcomputing particle-size statistics of fluvial sediments. Water ResourcesInvestigations Report 86-4141. USGS.• STEVENS Jr, Herbert H., and YANG, Chih Ted (1989). Summary and use ofselected fluvial sediment-discharge formulas. USGS, Water ResourcesInvestigations Report 89-4026. Denver, CO.• STEVENS Jr, Herbert H. (1985). Computer program for the computation of totalsediment discharge by the modified Einstein procedure. USGS, Water ResourcesInvestigations Report 85-4047. Lakewood, CO.• STRAND, Robert I. (1974). Sedimentation – Appendix H on Design of Small Dams.US Bureau of Reclamation. Washington, DC.• STRAND, R.I. and PEMBERTON, E.L. (1982). Reservoir sedimentation. TechnicalGuideline for US Bureau of Reclamation. Denver, CO.• SUBCOMMITTEE ON <strong>SEDIMENTATION</strong> (1940). Field practice and equipmentused in sampling suspended sediment. Interdepartmental Committee, Report no.1.Federal Inter-Agency Sedimentation Project. Iowa, University of Iowa.• SUBCOMMITTEE ON <strong>SEDIMENTATION</strong> (1943). A study of new methods forsize analysis of suspended sediment samples, Report Nº 7. Inter-Agency Committeeon Water Resources - University of Iowa. Iowa City.• SUBCOMMITTEE ON <strong>SEDIMENTATION</strong> (1957). Some fundamentals . ReportNo. 6 - Inter-Agency Committee on Water Resources - Minneapolis, Minnesota.• SUBCOMMITTEE ON <strong>SEDIMENTATION</strong> (1963). The design of improved typesof suspended sediment samplers. Report No. 6 - Inter-Agency Committee on WaterResources - Minneapolis, Minnesota.• SUBCOMMITTEE ON <strong>SEDIMENTATION</strong> (1963). Determination of fluvialsediment discharge, Report No. 14 - Inter-Agency Committee on Water Resources -Minneapolis, Minnesota.ANEEL – Brazilian Electricity Regulatory Agency / SIH – Hydrologic Studies and Information Department94
Reservoir Sedimentation Assessment Guideline• SUBCOMMITTEE ON <strong>SEDIMENTATION</strong> (1963). Measurement of the sedimentdischarge of streams, Report 8 - Inter-Agency Committee on Water Resources -Iowa City, Iowa.• SUBCOMMITTEE ON <strong>SEDIMENTATION</strong> (1986). Instruments and reports forfluvial sediment investigations. Catalog. Federal Inter-Agency SedimentationProject. Minneapolis, Minnesota.• SZALONA, J.J. (1982). Development of a bag type suspended sediment sampler.Inter-Agency Advisory Committee on Water Data. Report Y. Minneapolis,Minnesota.• UNDP – United Nations Development Programme (1977). Estudos Hidrológicos.Government of Central America Countries. Pub. N o 140. Managua.• UNESCO (1982). Sedimentation problems in river basins. Paris.• UNIVERSIDAD POLITÉCNICA DE MADRID (1984). Metodologia para laevaluación de la erosión hídrica. Departamento de Hidráulica e Hidrologia de laEscuela Técnica Superior de Ingenieros de Montes. Madrid.• USBR, Bureau of Reclamation (1967). The 1965 sedimentation survey of Angosturareservoir, South Dakota. Denver, CO.• USBR, Bureau of Reclamation (1955). Step method for computing total sedimentload by the modified Einstein procedure. Sedimentation Section, Hydrology Branch.• USGS, Geological Survey (1966). Water resources data for Utah. Part 2, Waterquality records. Salt Lake City, Utah.• UNEP, 1997 – Climate Change – Information Kit, United Nations EnvironmentPrograme´s Information Unit for Conventions, January, 1997.• VANONI, Vito A. (1977). Sedimentation Engineering. ASCE, American Society ofCivil Engineers. New York, NY.• WILSON Júnior, Geraldo (1973). Transporte e dispersão de sedimentos. UFOP,Ouro Preto Federal University. Ouro Preto, MG.• WILSON Júnior, Geraldo (1973). O estudo do transporte, da dispersão dossedimentos e da acumulação de poluentes nos escoamentos à superfície livre.UFOP, Ouro Preto Federal University. Ouro Preto, MG.• WMO, World Meteorological Organisation. Guide to Hydrological Practices.WMO-No. 168. Editions of 1981 and 1994. Geneva.• WMO, World Meteorological Organisation (1980). Technical regulations. WMO N o555. Geneva, Switzerland• YANG, Chih Ted (1996). Sediment transport - Theory and practice. The McGraw-Hill Companies, Inc. New York.• YUQIAN, Long (1989). Manual on operational methods for the measurement ofsediment transport. WMO, World Meteorological Organisation. Geneva,Switzerland.• ZHIDE, Zhou (1998). Assoreamento de reservatório e erosão à montante. Textbook for the course during the III ENES/ABRH. Belo Horizonte.ANEEL – Brazilian Electricity Regulatory Agency / SIH – Hydrologic Studies and Information Department95
Reservoir Sedimentation Assessment GuidelineGLOSSARY OF TERMS, SYMBOLS AND UNITSThe following definitions are provided in order to assist in the understanding ofthe terms used in this Guide. They were mainly obtained from the InternationalCommittee on Large Dams Guide (ICOLD, 1989) and publications from USGS.• AGGRADATION –Geologic process wherein streambeds, floodplains, sandbars,and the bottom of water bodies are raised in elevation by the deposition of sediment;the opposite of degradation.• ALLUVIAL – Pertaining to deposits of alluvia by either a water stream or runoff.• ALLUVIAL RIVER or ALLUVIAL STREAM – a stream in which the bed channelis made up by significant amounts of sediments transported by the runoff, and inwhich changes on the bed shape due to changes on the runoff usually occur.• ARGYLE – particles of sediments smaller than 0,004mm, according to AGUclassification. According to ABNT, argyle is particles with granulometry lower than0,005mm.• AVERAGE DIAMETER– the sediment size where half material is composed byparticles greater than the average diameter, and the other half is made up by smallerparticles.• BED or BOTTOM – the bed or bottom of a stream, reservoir or lake.• BED FRONT LAYERS DEPOSIT – a layer of sediment deposit on the top of adelta surface.• BED LOAD –Sediment that moves by jumping, rolling or sliding along or nearbythe streambed• BED-LOAD SEDIMENT DISCHARGE SAMPLER – equipment for directlymeasuring bed-load sediment discharge, for part or all the stream width.• BED MATERIAL- material composing the riverbed, usually made of fragmentedrocks.• BED MATERIAL DISCHARGE– the quantity of sediment passing through a crosssectioncorresponding to bed material particles in movement, both suspended and atthe bed.• BED MATERIAL SAMPLER – equipment for collecting a sampling of thesediment that composes the bed.• BED SEDIMENT DISCHARGE (usually called as entrainment sediment discharge)– the quantity of bed sediment passing through a cross-section in a time unit.• BED UPPER LAYERS DEPOSIT – sloped layers of sandy material settled along ahigher slope. That layer progressively covers an overbank and, on its turn, iscovered by a front layer.• CHANNEL – generic term for any natural or artificial water runoff having freesurface.• COHESIVE SEDIMENTS – sediments in which the initial resistance to movementor erosion is greatly affected by cohesion chain among particles.ANEEL – Brazilian Electricity Regulatory Agency / SIH – Hydrologic Studies and Information Department96
Reservoir Sedimentation Assessment Guideline• COMPOSITE SAMPLE – a sample made up by the combination of all individualsamples, or sub-samples, concerning a suspended sediment measurement performedby the process of equal width increment or equal discharge increment.• DEGRADATION – the geologic process wherein riverbeds, plain areas susceptibleto floods and other water bodies bed are lowered due to the removal of material. Isthe opposite of sedimentation.• DELTA – deposit of sediment made up where there is water in movement (such as ariver outfall).• DENSITY– the mass of a substance by volume unit, ρ in kg/l or t/m 3 .• DENSITY OF SEDIMENT-WATER MIXTURE – mass by volume unit, includingwater and sediment.• DENSITY STREAM – a stream reporting high turbidity and relative density thatusually moves along the bed of a still water body.• DEPOSITION – the mechanical or chemical process through which the sediment issettled in a still water site.• DRAINAGE AREA– The area that drains to a particular point on a river or stream.• DROPPING VELOCITY – the rate of fall or deposition of a particle in liquidmeans.• EROSION – the wearing away of ground by displacement of soil and rockfragments, due to the action of water movement and other geological agents.• FINE MATERIAL– particles reporting granulometry finer than particles present insignificant quantities of bed material; usually are silts and argyles (particles finerthan 0,062mm, according to AGU).• FINE MATERIAL LOAD or WASH LOAD –part of the total sediment load madeup of granulometry not significant in terms of quantities at the bed sediment, andconsisting of material finer than the bed material. Usually, the fine material load ismade up by particles smaller than 0,062mm; nevertheless, it is a function of the loadbeing transported by the river.• FLUVIAL SEDIMENT – all solid materials transported by river water and reportingan average density close to the one for fragmented rocks: 2,65.• GRANULOMETRIC DISTRIBUTION – the frequency distribution of the relativeamount of particles in a sampling, comprised by a granulometric band, or theaccumulated frequency distribution for a given amount of particles thicker or finerthan a given size. These amounts are expressed as percentage by mass.• GRAVEL – particles of sediment ranging from 64 to 2mm according to AGUclassification. According to ABNT, argyles have granulometry ranging from 76 to4,8mm.• INTEGRATOR-TYPE SEDIMENT SAMPLER – a sampler capable of isokineticallycollecting a water-sediment mixture while its beak is moved across theflow.• NET DISCHARGE or DISCHARGE – the amount of water passing through astream cross-section in a given time.• NON-COHESIVE SEDIMENTS – sediments made up by isolated particles.• NON-MEASURED SEDIMENT DISCHARGE – the quantity of sediment load thatthe sampler could not sample.ANEEL – Brazilian Electricity Regulatory Agency / SIH – Hydrologic Studies and Information Department97
Reservoir Sedimentation Assessment Guideline• NON-SAMPLED ZONE – distance from the sampler bill to the bottom of the river,in a sampling vertical, and that is not sampled; part of the cross-section that is notcovered by the sediment sampling.• OVERBANK – fine material, usually silts and argyles, deposited on the reservoirbed and that later may become covered by upper and front layers.• <strong>RESERVOIR</strong>– an artificial lake, basin or pan where a huge amount of water may bestored.• PARTICLE DIAMETER or SIZE – linear dimension used for characterizing thesize of a given particle. The diameter may be determined by any of the severaltechniques, including sedimentation, siftering, micrometric measures or directmeasurements.• SAMPLED ZONE – the part of the cross-section that is represented by sedimentsamplings.• SAND – sediment particles with granulometry ranging from 0,062 to 2,0mmaccording to AGU classification. According to ABNT, they are particles withgranulometry ranging from 0,05 to 4,8mm.• SCOUR – the enlargement of a section by material removal due to the action of afluid in movement.• SEDIMENT – a) particles deriving from rocky or biological materials that aretransported through a fluid; b) suspended material or material settled on bed.• <strong>SEDIMENTATION</strong> – a comprehensive term that comprises the five basic processesfor building sedimentary rocks: a) intemperism; b) detachment; c) transportation, d)deposition (sedimentation) and, e) diagenesis; sedimentation is also defined as thegravitational deposition of suspended particles that are heavier than water.(b)sediment deposit on a bed river or reservoir thatjeopardizes the water resource management.• SEDIMENT CONCENTRATION – the quantity of sediment in relation to thetransported amount of water or water-sediment mixture. The dry weight of solidscontained in the water-sediment mixture in relation to the volume of the mixture(mg/l) or in relation to the mixture weight (ppm).• SEDIMENT DISCHARGE– Rate at which sediment passes a stream cross-sectionin a given period of time. The sediment discharge may be limited or refer to somesediment granulometry, as well as be considered at a specific part of the crosssection,due to either bed or a section segment suspended sediment.• SEDIMENT LOAD– the sediment being transported by a stream (load refers to thematerial itself and not to the quantity being transported).• SEDIMENT SPECIFIC WEIGHT - dry weight by sediment volume unit or dryweight of the sediment in relation to volume.• SEDIMENT YIELD – the total amount of tributary sediment in a hydrograph basinor drainage area in a reference point and during a specific period of time. It isequivalent to the sediment discharge in relation to the drainage area.• SHIELDING– The formation of a resistant layer made up by particles relativelygreater, resulting from the removal of fine particles by erosion.• SILT – sediment particles reporting granulometry between argyle and sand (0,004 to0,062mm according to AGU or 0,005 to 0,05mm according to ABNT).ANEEL – Brazilian Electricity Regulatory Agency / SIH – Hydrologic Studies and Information Department98
Reservoir Sedimentation Assessment Guideline• STATION or FLUVIOMETRIC GAGING STATION – a river channel crosssectionwhere one or more variables are measured, either continuously orperiodically.• STONE – particles of sediment ranging from 256 to 64mm according to AGUclassification.• SUSPENDED SEDIMENT or SUSPENDED LOAD – sediment that is transportedby ascending components of turbulent streams, and that remains suspended for aconsiderable time period.• SUSPENDED SEDIMENT DISCHARGE – the quantity of sediment passingthrough a stream cross-section in a time unit.• THALWEG – Deepest part of a river.• TOTAL LOAD – the total sediment being carried along a stream.• TOTAL SEDIMENT DISCHARGE – the total sediment discharge for a stream. Itincludes the measured suspended discharged, the non-measured suspendeddischarge and the bed discharge.• TRANSIT or ROUTE VELOCITY – velocity in which the sediment load sampler issubmerged into a vertical integration sampling.• VERTICAL INTEGRATION SAMPLE – water-sediment mixture that iscontinuously accumulated in a sampler that moves vertically in an almost constanttransit rate, between surface and a point a few centimeters immediately above thebed. The mixture enters in a velocity almost equivalent to the stream instantaneousvelocity at each point in vertical. Since the sampler bill remains above the bottom,there is a zone that is not sampled, few centimeters in depth, right above theriverbed (see non- sampled zone).• VERTICAL or DEPTH INTEGRATION – sampling method for obtaining arepresentative sample of water-sediment discharge for the whole vertical, except forthe non-sampled zone nearby the bed.• VERTICAL FOR SAMPLING or just VERTICAL – a line approximately vertical,from the water surface to the bed, where samplings are taken in order to define thesediment concentration or granulometry.ANEEL – Brazilian Electricity Regulatory Agency / SIH – Hydrologic Studies and Information Department99
Reservoir Sedimentation Assessment GuidelineSymbols and units as recommended for studying sediments transportation in streams(WMO, 1980)Element Symbol Unit NoteAcceleration due to gravity g m s -2 ISOArea (cross-section) A m 2 ISOArea (drainage area) A km 2 ISO (there is also in use)Chézy coefficient [v(R h S) 1/2 ] C m 1/2 s -1 ISOConveyance (coefficient) K m 3 s -1 ISODensity ρ kg m -3 ISODepth, diameter,ThicknessDischarge(river runoff)(by unit of area Q A -1 , orpartial)DQqmcmm 3 s -1m 3 s -1 km -2l s -1 km -2ISOISOISOKinematics viscosity υ m 2 s -1 ISOLength L cmmkmISOManning Coefficientn s m -1/3 ISO= R 2/3 h S 1/2 v -1Mass M kg ISOgSediment concentration C s mg l -1 Or ppmkg m -3 Also used g m -3Sediment discharge (or sediment) Q s t d -1Shearing tension τ Pa ISOSlope (hydraulics, basin) S Non-dimension ISONumberTemperatureθo C ISOtTotal dissolved solids M d mg l -1 (for diluted solution)ppm is also usedVelocity (water) v m s -1 ISOVolume V m 3 ISOWet perimeter P w mWidth (cross-section,Basin)BmkmISOANEEL – Brazilian Electricity Regulatory Agency / SIH – Hydrologic Studies and Information Department100
Reservoir Sedimentation Assessment GuidelineSediment classification according to granulometry byAGU, American Geophysical Union (Wentworth Classification)GranulometricClassificationMillimeter Micron Feet TylerStandard(mm) (μ) (in) (sifterdiameter)USStandard(sifterdiameter)Very big cobblestone 4096 – 2048 160 - 80Big cobblestone 2048 – 1024 80 - 40Medium cobblestone 1024 - 512 40 - 20Small cobblestone 512 - 256 20 - 10Big stone 256 – 128 10 - 5Small stone 128 - 64 5 - 2.5Very thick gravel 64 – 32 2.5 - 1.3Thick gravel 32 – 16 1.3 - 0.6Medium gravel 16 - 8 0.6 - 0.3 2 - ½Fine gravel 8 – 4 0.3 – 0.16 5 5Very fine gravel 4 – 2 0.16 - 0.08 9 10Very thick sand 2.000 - 1.000 2000 - 1000 16 18Thick sand 1.000 - 0.500 1000 - 500 32 35Medium sand 0.500 - 0.250 500 - 250 60 60Fine sand 0.250 - 0.125 250 - 125 115 120Very fine sand 0.125 - 0.062 125 - 62 250 230Thick silt 0.062 - 0.031 62 - 31Medium silt 0.031 - 0.016 31 - 16Fine silt 0.016 - 0.008 16 - 8Very fine silt 0.008 - 0.004 8 - 4Thick argyle 0.004 - 0.0020 4 - 2Medium argyle 0.0020 - 0.0010 2 - 1Fine argyle 0.0010 - 0.0005 1 - 0.5Very fine argyle 0.0005 - 0.00024 0.5 - 0.24Colloid < 0.00024 < 0.24Notes: 1) For some countries, including Brazil, the following classification is adoptedby ABNT (Atterberg Classification) -Gravel: 76 - 4.8 mmSand: 4.8 - 0.05 mmSilt: 0.05 - 0.005 mmArgyle: < 0.005 mm2) AGU classification is used in these works due to the use of formulas andsoftware developed in Britannic measurement units.ANEEL – Brazilian Electricity Regulatory Agency / SIH – Hydrologic Studies and Information Department101