RESERVOIR SEDIMENTATION ASSESSMENT GUIDELINE - Aneel
RESERVOIR SEDIMENTATION ASSESSMENT GUIDELINE - Aneel
RESERVOIR SEDIMENTATION ASSESSMENT GUIDELINE - Aneel

You also want an ePaper? Increase the reach of your titles
YUMPU automatically turns print PDFs into web optimized ePapers that Google loves.
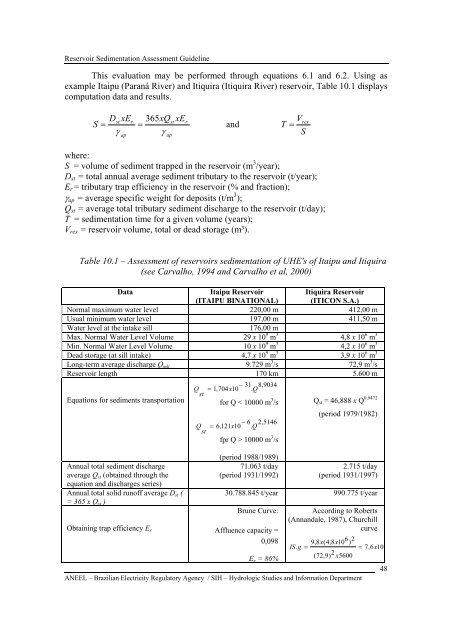
Reservoir Sedimentation Assessment GuidelineThis evaluation may be performed through equations 6.1 and 6.2. Using asexample Itaipu (Paraná River) and Itiquira (Itiquira River) reservoir, Table 10.1 displayscomputation data and results.SDxEst rst r= =andγap365xQγapxETV=Sreswhere:S = volume of sediment trapped in the reservoir (m 3 /year);D st = total annual average sediment tributary to the reservoir (t/year);E r = tributary trap efficiency in the reservoir (% and fraction);γ ap = average specific weight for deposits (t/m 3 );Q st = average total tributary sediment discharge to the reservoir (t/day);T = sedimentation time for a given volume (years);V res = reservoir volume, total or dead storage (m³).Table 10.1 – Assessment of reservoirs sedimentation of UHE's of Itaipu and Itiquira(see Carvalho, 1994 and Carvalho et al, 2000)DataItaipu Reservoir(ITAIPU BINATIONAL)Itiquira Reservoir(ITICON S.A.)Normal maximum water level 220,00 m 412,00 mUsual minimum water level 197,00 m 411,50 mWater level at the intake sill176,00 mMax. Normal Water Level Volume 29 x 10 9 m 3 4,8 x 10 6 m 3Min. Normal Water Level Volume 10 x 10 9 m 3 4,2 x 10 6 m 3Dead storage (at sill intake) 4,7 x 10 9 m 3 3,9 x 10 6 m 3Long-term average discharge Q mlt 9.729 m 3 /s 72,9 m 3 /sReservoir length 170 km 5.600 m− 31 8,9034Q = 1,704x10. QstEquations for sediments transportation for Q < 10000 m 3 /s Q st = 46,888 x Q 0,9472(period 1979/1982)− 6 2,5146Q = 6,121x10. Qstfpr Q > 10000 m 3 /sAnnual total sediment dischargeaverage Q st (obtained through theequation and discharges series)Annual total solid runoff average D st (= 365 x Q st )Obtaining trap efficiency E r(period 1988/1989)71.063 t/day(period 1931/1992)2.715 t/day(period 1931/1997)30.788.845 t/year 990.775 t/yearBrune Curve:Affluence capacity =0,098E r = 86%According to Roberts(Annandale, 1987), Churchillcurve9,8x(4,8x106)2IS . g == 7,6x10(72,9)2x5600ANEEL – Brazilian Electricity Regulatory Agency / SIH – Hydrologic Studies and Information Department48