Setup of a Drift Tube Muon Tracker and Calibration of Muon ...
Setup of a Drift Tube Muon Tracker and Calibration of Muon ...
Setup of a Drift Tube Muon Tracker and Calibration of Muon ...

You also want an ePaper? Increase the reach of your titles
YUMPU automatically turns print PDFs into web optimized ePapers that Google loves.
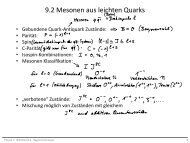
θN [per 5°]908070hthetaEntries 649Mean 0.6072RMS 0.2375ϕN [per 20°]7060hphiEntries 649Mean 3.206RMS 2.022605050404030203020101000 0.2 0.4 0.6 0.8 1 1.2 1.4θ00 1 2 3 4 5 6ϕFigure 5.9: Zenith <strong>and</strong> azimuth angular distributions for events observed by theCMT. The filled area shows the actual data wheres the red crosses show the resultsfrom the Monte Carlo simulation.5.2 Commissioning <strong>and</strong> Early ResultsAlthough the detector was installed already in November 2009, the commissioningdid not start until late January 2010 due to a missing gas supply. Because <strong>of</strong> thelow flux <strong>of</strong> cosmic muons a check <strong>of</strong> the detector functionality takes a few daysto gather enough statistics. The detector is running at all times, however due tooccasional power cuts in the laboratory, there are some discontinuities in the data.After a power cut, data taking has to be resumed manually. In the first weeks <strong>of</strong>data taking, some <strong>of</strong> these restarts <strong>of</strong> the detector unfortunately remained unnoticedfor a couple <strong>of</strong> days. Meanwhile, an automatic email alert system has been set upsending out warning messages whenever there is a restart <strong>of</strong> the system. However,it is foreseen to connect the CMT to a UPS 1 in the near future to both ensurecontinuous data taking <strong>and</strong> to prevent the system from any damage.Data taking started on January 28 th 2010. The results presented here rely on thedata taken until the 6 th <strong>of</strong> September 2010. An overview <strong>of</strong> the runs taken duringthis period is given in Tab. 5.3. A 2D projection <strong>of</strong> a typical event is depicted inFig. 5.10 <strong>and</strong> Fig. 5.11 shows a different event in the 3D display.5.2.1 A First Look at EventsDue to the small muon rate, the overall number <strong>of</strong> events is too little for selfcalibration.Therefore, a calibration was done in Hamburg before setting up thedetector underground. Of course, this calibration suffers from the different ambientconditions in the laboratories in Hamburg <strong>and</strong> Gran Sasso, the main differencesbeing pressure <strong>and</strong> temperature. Three attempts <strong>of</strong> a calibration have been made:First, a reconstruction was done with the original CMT calibration from the testmeasurements before shipping the detector to Gran Sasso. Second, a calibrationobtained by a similar detector setup in Hamburg which uses a gas system to control1 UPS: Uninterruptable Power Supply77