Baldwin TD and Hicks TW, Assessment Calculations for Human ...
Baldwin TD and Hicks TW, Assessment Calculations for Human ...
Baldwin TD and Hicks TW, Assessment Calculations for Human ...

Create successful ePaper yourself
Turn your PDF publications into a flip-book with our unique Google optimized e-Paper software.
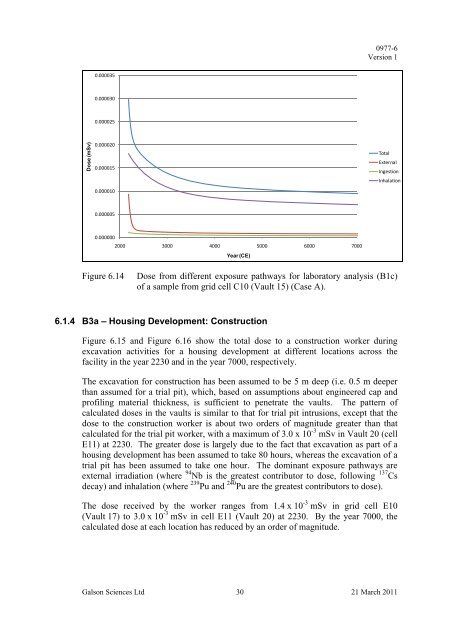
0977-6Version 10.0000350.0000300.000025Dose (mSv)0.0000200.0000150.000010TotalExternalIngestionInhalation0.0000050.0000002000 3000 4000 5000 6000 7000Year (CE)Figure 6.14Dose from different exposure pathways <strong>for</strong> laboratory analysis (B1c)of a sample from grid cell C10 (Vault 15) (Case A).6.1.4 B3a – Housing Development: ConstructionFigure 6.15 <strong>and</strong> Figure 6.16 show the total dose to a construction worker duringexcavation activities <strong>for</strong> a housing development at different locations across thefacility in the year 2230 <strong>and</strong> in the year 7000, respectively.The excavation <strong>for</strong> construction has been assumed to be 5 m deep (i.e. 0.5 m deeperthan assumed <strong>for</strong> a trial pit), which, based on assumptions about engineered cap <strong>and</strong>profiling material thickness, is sufficient to penetrate the vaults. The pattern ofcalculated doses in the vaults is similar to that <strong>for</strong> trial pit intrusions, except that thedose to the construction worker is about two orders of magnitude greater than thatcalculated <strong>for</strong> the trial pit worker, with a maximum of 3.0 x 10 -3 mSv in Vault 20 (cellE11) at 2230. The greater dose is largely due to the fact that excavation as part of ahousing development has been assumed to take 80 hours, whereas the excavation of atrial pit has been assumed to take one hour. The dominant exposure pathways areexternal irradiation (where 94 Nb is the greatest contributor to dose, following 137 Csdecay) <strong>and</strong> inhalation (where 239 Pu <strong>and</strong> 240 Pu are the greatest contributors to dose).The dose received by the worker ranges from 1.4 x 10 -3 mSv in grid cell E10(Vault 17) to 3.0 x 10 -3 mSv in cell E11 (Vault 20) at 2230. By the year 7000, thecalculated dose at each location has reduced by an order of magnitude.Galson Sciences Ltd 30 21 March 2011