Baldwin TD and Hicks TW, Assessment Calculations for Human ...
Baldwin TD and Hicks TW, Assessment Calculations for Human ...
Baldwin TD and Hicks TW, Assessment Calculations for Human ...

Create successful ePaper yourself
Turn your PDF publications into a flip-book with our unique Google optimized e-Paper software.
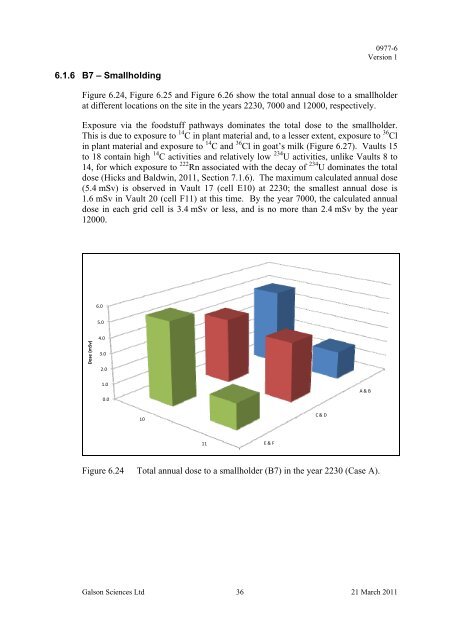
0977-6Version 16.1.6 B7 – SmallholdingFigure 6.24, Figure 6.25 <strong>and</strong> Figure 6.26 show the total annual dose to a smallholderat different locations on the site in the years 2230, 7000 <strong>and</strong> 12000, respectively.Exposure via the foodstuff pathways dominates the total dose to the smallholder.This is due to exposure to 14 C in plant material <strong>and</strong>, to a lesser extent, exposure to 36 Clin plant material <strong>and</strong> exposure to 14 C <strong>and</strong> 36 Cl in goat’s milk (Figure 6.27). Vaults 15to 18 contain high 14 C activities <strong>and</strong> relatively low 234 U activities, unlike Vaults 8 to14, <strong>for</strong> which exposure to 222 Rn associated with the decay of 234 U dominates the totaldose (<strong>Hicks</strong> <strong>and</strong> <strong>Baldwin</strong>, 2011, Section 7.1.6). The maximum calculated annual dose(5.4 mSv) is observed in Vault 17 (cell E10) at 2230; the smallest annual dose is1.6 mSv in Vault 20 (cell F11) at this time. By the year 7000, the calculated annualdose in each grid cell is 3.4 mSv or less, <strong>and</strong> is no more than 2.4 mSv by the year12000.6.05.0Dose (mSv)4.03.02.01.00.0A & B10C & D11E & FFigure 6.24Total annual dose to a smallholder (B7) in the year 2230 (Case A).Galson Sciences Ltd 36 21 March 2011