Year Ended March 31, 2008 - Lumax Auto Technologies Ltd.
Year Ended March 31, 2008 - Lumax Auto Technologies Ltd.
Year Ended March 31, 2008 - Lumax Auto Technologies Ltd.

Create successful ePaper yourself
Turn your PDF publications into a flip-book with our unique Google optimized e-Paper software.
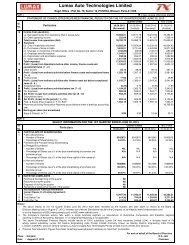
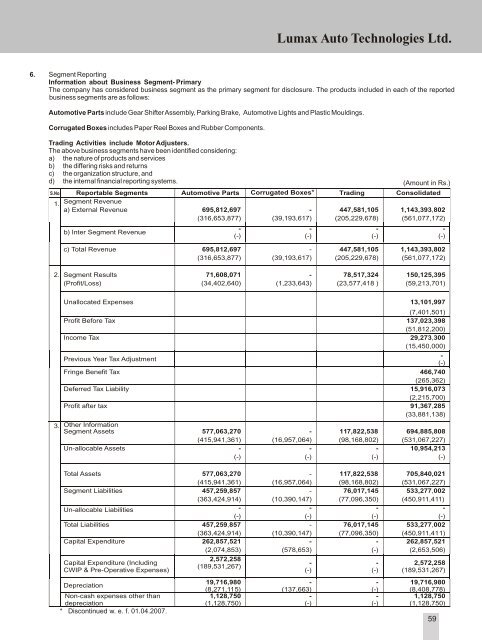
<strong>Lumax</strong> <strong>Auto</strong> <strong>Technologies</strong> <strong>Ltd</strong>.6. Segment ReportingInformation about Business Segment- PrimaryThe company has considered business segment as the primary segment for disclosure. The products included in each of the reportedbusiness segments are as follows:<strong>Auto</strong>motive Parts include Gear Shifter Assembly, Parking Brake, <strong>Auto</strong>motive Lights and Plastic Mouldings.Corrugated Boxes includes Paper Reel Boxes and Rubber Components.Trading Activities include Motor Adjusters.The above business segments have been identified considering:a) the nature of products and servicesb) the differing risks and returnsc) the organization structure, andd) the internal financial reporting systems.S.No. Reportable Segments <strong>Auto</strong>motive Parts Corrugated Boxes * Trading Consolidated1. Segment Revenuea) External Revenue 695,812,697 - 447,581,105 1,143,393,802(<strong>31</strong>6,653,877) (39,193,617) (205,229,678) (561,077,172)b) Inter Segment Revenue-(-)c) Total Revenue 695,812,697 - 447,581,105 1,143,393,802(<strong>31</strong>6,653,877) (39,193,617) (205,229,678) (561,077,172)2. Segment Results 71,608,071 - 78,517,324 150,125,395(Profit/Loss) (34,402,640) (1,233,643) (23,577,418 ) (59,213,701)-(-)-(-)(Amount in Rs.)-(-)Unallocated Expenses 13,101,997(7,401,501)Profit Before Tax 137,023,398(51,812,200)Income Tax 29,273,300(15,450,000)-Previous <strong>Year</strong> Tax Adjustment(-)Fringe Benefit Tax 466,740(265,362)Deferred Tax Liability 15,916,073(2,215,700)Profit after tax 91,367,285(33,881,138)3. Other InformationSegment Assets 577,063,270 - 117,822,538 694,885,808(415,941,361) (16,957,064) (98,168,802) (5<strong>31</strong>,067,227)Un-allocable Assets- - - 10,954,213(-) (-) (-) (-)Total Assets 577,063,270 - 117,822,538 705,840,021(415,941,361) (16,957,064) (98,168,802) (5<strong>31</strong>,067,227)Segment Liabilities 457,259,857 - 76,017,145 533,277,002(363,424,914) (10,390,147) (77,096,350) (450,911,411)Un-allocable Liabilities - - - -(-) (-) (-) (-)Total Liabilities 457,259,857 - 76,017,145 533,277,002(363,424,914) (10,390,147) (77,096,350) (450,911,411)Capital Expenditure 262,857,521 - - 262,857,521(2,074,853) (578,653) (-) (2,653,506)Capital Expenditure (IncludingCWIP & Pre-Operative Expenses)DepreciationNon-cash expenses other thandepreciation* Discontinued w. e. f. 01.04.2007.2,572,258(189,5<strong>31</strong>,267)19,716,980(8,271,115)1,128,750(1,128,750)-(-)-(137,663)-(-)-(-)-(-)-(-)2,572,258(189,5<strong>31</strong>,267)19,716,980(8,408,778)1,128,750(1,128,750)59