Pearson-Exploring-Effective-Pedagogy-in-Primary-Schools
Pearson-Exploring-Effective-Pedagogy-in-Primary-Schools
Pearson-Exploring-Effective-Pedagogy-in-Primary-Schools
Create successful ePaper yourself
Turn your PDF publications into a flip-book with our unique Google optimized e-Paper software.
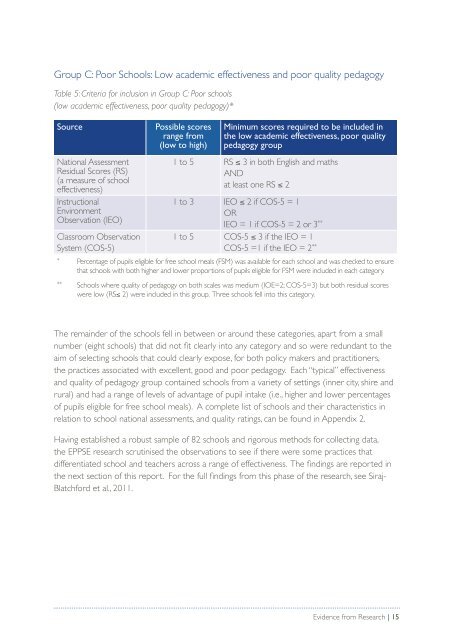
Group C: Poor <strong>Schools</strong>: Low academic effectiveness and poor quality pedagogyTable 5: Criteria for <strong>in</strong>clusion <strong>in</strong> Group C: Poor schools(low academic effectiveness, poor quality pedagogy)*SourceNational AssessmentResidual Scores (RS)(a measure of schooleffectiveness)InstructionalEnvironmentObservation (IEO)Classroom ObservationSystem (COS-5)Possible scoresrange from(low to high)M<strong>in</strong>imum scores required to be <strong>in</strong>cluded <strong>in</strong>the low academic effectiveness, poor qualitypedagogy group1 to 5 RS ≤ 3 <strong>in</strong> both English and mathsANDat least one RS ≤ 21 to 3 IEO ≤ 2 if COS-5 = 1ORIEO = 1 if COS-5 = 2 or 3 **1 to 5 COS-5 ≤ 3 if the IEO = 1COS-5 =1 if the IEO = 2 *** Percentage of pupils eligible for free school meals (FSM) was available for each school and was checked to ensurethat schools with both higher and lower proportions of pupils eligible for FSM were <strong>in</strong>cluded <strong>in</strong> each category.** <strong>Schools</strong> where quality of pedagogy on both scales was medium (IOE=2; COS-5=3) but both residual scoreswere low (RS≤ 2) were <strong>in</strong>cluded <strong>in</strong> this group. Three schools fell <strong>in</strong>to this category.The rema<strong>in</strong>der of the schools fell <strong>in</strong> between or around these categories, apart from a smallnumber (eight schools) that did not fit clearly <strong>in</strong>to any category and so were redundant to theaim of select<strong>in</strong>g schools that could clearly expose, for both policy makers and practitioners,the practices associated with excellent, good and poor pedagogy. Each “typical” effectivenessand quality of pedagogy group conta<strong>in</strong>ed schools from a variety of sett<strong>in</strong>gs (<strong>in</strong>ner city, shire andrural) and had a range of levels of advantage of pupil <strong>in</strong>take (i.e., higher and lower percentagesof pupils eligible for free school meals). A complete list of schools and their characteristics <strong>in</strong>relation to school national assessments, and quality rat<strong>in</strong>gs, can be found <strong>in</strong> Appendix 2.Hav<strong>in</strong>g established a robust sample of 82 schools and rigorous methods for collect<strong>in</strong>g data,the EPPSE research scrut<strong>in</strong>ised the observations to see if there were some practices thatdifferentiated school and teachers across a range of effectiveness. The f<strong>in</strong>d<strong>in</strong>gs are reported <strong>in</strong>the next section of this report. For the full f<strong>in</strong>d<strong>in</strong>gs from this phase of the research, see Siraj-Blatchford et al., 2011.Evidence from Research | 15


