BBK Annual Report 2011
BBK Annual Report 2011
BBK Annual Report 2011

You also want an ePaper? Increase the reach of your titles
YUMPU automatically turns print PDFs into web optimized ePapers that Google loves.
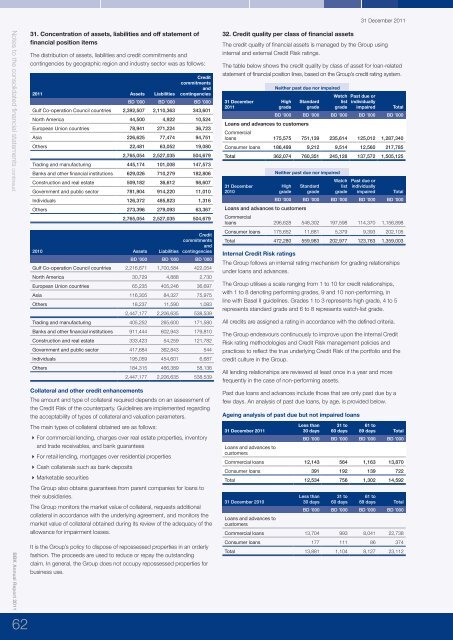
31 December <strong>2011</strong>Notes to the consolidated financial statements contineud<strong>BBK</strong> <strong>Annual</strong> <strong>Report</strong> <strong>2011</strong>6231. Concentration of assets, liabilities and off statement offinancial position itemsThe distribution of assets, liabilities and credit commitments andcontingencies by geographic region and industry sector was as follows:<strong>2011</strong> Assets LiabilitiesCreditcommitmentsandcontingenciesBD ’000 BD ’000 BD ’000Gulf Co-operation Council countries 2,392,507 2,110,363 343,601North America 44,500 4,922 10,524European Union countries 78,941 271,224 36,723Asia 226,625 77,474 94,751Others 22,481 63,052 19,0802,765,054 2,527,035 504,679Trading and manufacturing 445,174 101,008 147,573Banks and other financial institutions 629,026 710,279 182,806Construction and real estate 509,182 36,612 98,607Government and public sector 781,904 914,220 11,010Individuals 126,372 485,823 1,316Others 273,396 279,093 63,3672,765,054 2,527,035 504,6792010 Assets LiabilitiesCreditcommitmentsandcontingenciesBD ’000 BD ’000 BD ’000Gulf Co-operation Council countries 2,216,671 1,700,584 422,054North America 30,729 4,888 2,730European Union countries 65,235 405,246 36,697Asia 116,305 84,327 75,975Others 18,237 11,590 1,0832,447,177 2,206,635 538,539Trading and manufacturing 405,252 265,600 171,580Banks and other financial institutions 911,444 602,943 179,810Construction and real estate 333,423 54,259 121,782Government and public sector 417,684 362,843 544Individuals 195,059 454,601 6,687Others 184,315 466,389 58,136Collateral and other credit enhancements2,447,177 2,206,635 538,539The amount and type of collateral required depends on an assessment ofthe Credit Risk of the counterparty. Guidelines are implemented regardingthe acceptability of types of collateral and valuation parameters.The main types of collateral obtained are as follows:For commercial lending, charges over real estate properties, inventoryand trade receivables, and bank guaranteesFor retail lending, mortgages over residential propertiesCash collaterals such as bank depositsMarketable securitiesThe Group also obtains guarantees from parent companies for loans totheir subsidiaries.The Group monitors the market value of collateral, requests additionalcollateral in accordance with the underlying agreement, and monitors themarket value of collateral obtained during its review of the adequacy of theallowance for impairment losses.It is the Group’s policy to dispose of repossessed properties in an orderlyfashion. The proceeds are used to reduce or repay the outstandingclaim. In general, the Group does not occupy repossessed properties forbusiness use.32. Credit quality per class of financial assetsThe credit quality of financial assets is managed by the Group usinginternal and external Credit Risk ratings.The table below shows the credit quality by class of asset for loan-relatedstatement of financial position lines, based on the Group’s credit rating system.31 December<strong>2011</strong>Neither past due nor impairedHighgradeLoans and advances to customersStandardgradeWatchlistgradePast due orindividuallyimpairedTotalBD ’000 BD ’000 BD ’000 BD ’000 BD ’000Commercialloans 175,575 751,139 235,614 125,012 1,287,340Consumer loans 186,499 9,212 9,514 12,560 217,785Total 362,074 760,351 245,128 137,572 1,505,12531 December2010Neither past due nor impairedHighgradeLoans and advances to customersStandardgradeWatchlistgradePast due orindividuallyimpairedTotalBD ’000 BD ’000 BD ’000 BD ’000 BD ’000Commercialloans 296,628 548,302 197,598 114,370 1,156,898Consumer loans 175,652 11,681 5,379 9,393 202,105Total 472,280 559,983 202,977 123,763 1,359,003Internal Credit Risk ratingsThe Group follows an internal rating mechanism for grading relationshipsunder loans and advances.The Group utilises a scale ranging from 1 to 10 for credit relationships,with 1 to 8 denoting performing grades, 9 and 10 non-performing, inline with Basel II guidelines. Grades 1 to 3 represents high grade, 4 to 5represents standard grade and 6 to 8 represents watch-list grade.All credits are assigned a rating in accordance with the defined criteria.The Group endeavours continuously to improve upon the internal CreditRisk rating methodologies and Credit Risk management policies andpractices to reflect the true underlying Credit Risk of the portfolio and thecredit culture in the Group.All lending relationships are reviewed at least once in a year and morefrequently in the case of non-performing assets.Past due loans and advances include those that are only past due by afew days. An analysis of past due loans, by age, is provided below.Ageing analysis of past due but not impaired loans31 December <strong>2011</strong>Loans and advances tocustomersLess than30 days31 to60 days61 to89 days TotalBD ’000 BD ’000 BD ’000 BD ’000Commercial loans 12,143 564 1,163 13,870Consumer loans 391 192 139 722Total 12,534 756 1,302 14,59231 December 2010Loans and advances tocustomersLess than30 days31 to60 days61 to89 days TotalBD ’000 BD ’000 BD ’000 BD ’000Commercial loans 13,704 993 8,041 22,738Consumer loans 177 111 86 374Total 13,881 1,104 8,127 23,112