Statewide Quality Assurance Report
Child Welfare Services Statewide Quality Assurance Report - Florida ...
Child Welfare Services Statewide Quality Assurance Report - Florida ...
- No tags were found...

Create successful ePaper yourself
Turn your PDF publications into a flip-book with our unique Google optimized e-Paper software.
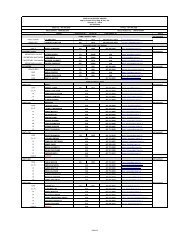
Florida Department of Children and FamiliesCase Management Services - 2009-2010 <strong>Quality</strong> <strong>Assurance</strong> <strong>Report</strong>• Well-being 1: Families have enhanced capacity to provide for their children’s needs• Well-being 2: Children receive appropriate services to meet their educational needs• Well-being 3: Children receive adequate services to meet their physical and mental healthneedsThe tables on the following pages illustrate Florida’s performance at the Circuit, Region andState level on the federal data indicators associated with the CFSR Permanency Outcome. Theseindicators make up the four Permanency Composites for which the Department is held accountablein the Child and Family Services Review. Data for determining performance on these measurescomes from ad-hoc reports programmed from the Florida Safe Families Network (FSFN). There arefive measures shaded in blue that are both federal measures and CBC contract measures. Thesemeasures are color coded with a green, yellow, or red icon to identify areas of high and lowperformance. Performance is compared to the national median and 75 th percentile (located at thebottom of each table) from the 2008 federal fiscal year.• Percentage at or above the national 75 th percentile: green icon (good performance)• Percentage between the national median and 75th percentile: yellow icon (cautionary)• Percentage below the national median: red icon (improvement needed)There is one contract measure where the national median and national 75 th percentile is a lowpercentage. Therefore, a low percentage equates to good performance.• Percentage less than the 75th percentile: green icon (good performance)• Percentage between the median and 75th percentile: yellow icon (cautionary)• Percentage higher than the national median: red icon (improvement needed)It should be noted that statewide performance on these measures will be slightly different thanthe performance calculated by the Administration for Children and Families.Office of Family Safety | Page 52