Informe de perspectiva 2 - Web del Profesor
Informe de perspectiva 2 - Web del Profesor
Informe de perspectiva 2 - Web del Profesor
- No tags were found...

You also want an ePaper? Increase the reach of your titles
YUMPU automatically turns print PDFs into web optimized ePapers that Google loves.
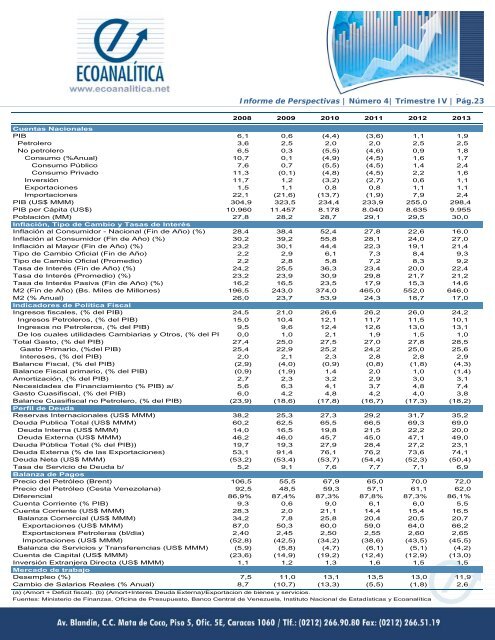
<strong>Informe</strong> <strong>de</strong> Perspectivas | Número 4| Trimestre IV | Pág.232008 2009 2010 2011 2012 2013Cuentas NacionalesPIB 6,1 0,6 (4,4) (3,6) 1,1 1,9Petrolero 3,6 2,5 2,0 2,0 2,5 2,5No petrolero 6,5 0,3 (5,5) (4,6) 0,9 1,8Consumo (%Anual) 10,7 0,1 (4,9) (4,5) 1,6 1,7Consumo Público 7,6 0,7 (5,5) (4,5) 1,4 2,4Consumo Privado 11,3 (0,1) (4,8) (4,5) 2,2 1,6Inversión 11,7 1,2 (3,2) (2,7) 0,6 1,1Exportaciones 1,5 1,1 0,8 0,8 1,1 1,1Importaciones 22,1 (21,6) (13,7) (1,9) 7,9 2,4PIB (US$ MMM) 304,9 323,5 234,4 233,9 255,0 298,4PIB per Cápita (US$) 10.960 11.457 8.178 8.040 8.635 9.955Población (MM) 27,8 28,2 28,7 29,1 29,5 30,0Inflación, Tipo <strong>de</strong> Cambio y Tasas <strong>de</strong> InterésInflación al Consumidor - Nacional (Fin <strong>de</strong> Año) (%) 28,4 38,4 52,4 27,8 22,6 16,0Inflación al Consumidor (Fin <strong>de</strong> Año) (%) 30,2 39,2 55,8 28,1 24,0 27,0Inflación al Mayor (Fin <strong>de</strong> Año) (%) 23,2 30,1 44,4 22,3 19,1 21,4Tipo <strong>de</strong> Cambio Oficial (Fin <strong>de</strong> Año) 2,2 2,9 6,1 7,3 8,4 9,3Tipo <strong>de</strong> Cambio Oficial (Promedio) 2,2 2,8 5,8 7,2 8,3 9,2Tasa <strong>de</strong> Interés (Fin <strong>de</strong> Año) (%) 24,2 25,5 36,3 23,4 20,0 22,4Tasa <strong>de</strong> Interés (Promedio) (%) 23,2 23,9 30,9 29,8 21,7 21,2Tasa <strong>de</strong> Interés Pasiva (Fin <strong>de</strong> Año) (%) 16,2 16,5 23,5 17,9 15,3 14,6M2 (Fin <strong>de</strong> Año) (Bs. Miles <strong>de</strong> Millones) 196,5 243,0 374,0 465,0 552,0 646,0M2 (% Anual) 26,0 23,7 53,9 24,3 18,7 17,0Indicadores <strong>de</strong> Política FiscalIngresos fiscales, (% <strong>de</strong>l PIB) 24,5 21,0 26,6 26,2 26,0 24,2Ingresos Petroleros, (% <strong>de</strong>l PIB) 15,0 10,4 12,1 11,7 11,5 10,1Ingresos no Petroleros, (% <strong>de</strong>l PIB) 9,5 9,6 12,4 12,6 13,0 13,1De los cuales utilida<strong>de</strong>s Cambiarias y Otros, (% <strong>de</strong>l PI 0,0 1,0 2,1 1,9 1,5 1,0Total Gasto, (% <strong>de</strong>l PIB) 27,4 25,0 27,5 27,0 27,8 28,5Gasto Primario, (%<strong>de</strong>l PIB) 25,4 22,9 25,2 24,2 25,0 25,6Intereses, (% <strong>de</strong>l PIB) 2,0 2,1 2,3 2,8 2,8 2,9Balance Fiscal, (% <strong>de</strong>l PIB) (2,9) (4,0) (0,9) (0,8) (1,8) (4,3)Balance Fiscal primario, (% <strong>de</strong>l PIB) (0,9) (1,9) 1,4 2,0 1,0 (1,4)Amortización, (% <strong>de</strong>l PIB) 2,7 2,3 3,2 2,9 3,0 3,1Necesida<strong>de</strong>s <strong>de</strong> Financiamiento (% PIB) a/ 5,6 6,3 4,1 3,7 4,8 7,4Gasto Cuasifiscal, (% <strong>de</strong>l PIB) 6,0 4,2 4,8 4,2 4,0 3,8Balance Cuasifiscal no Petrolero, (% <strong>de</strong>l PIB) (23,9) (18,6) (17,8) (16,7) (17,3) (18,2)Perfil <strong>de</strong> DeudaReservas Internacionales (US$ MMM) 38,2 25,3 27,3 29,2 31,7 35,2Deuda Publica Total (US$ MMM) 60,2 62,5 65,5 66,5 69,3 69,0Deuda Interna (US$ MMM) 14,0 16,5 19,8 21,5 22,2 20,0Deuda Externa (US$ MMM) 46,2 46,0 45,7 45,0 47,1 49,0Deuda Pública Total (% <strong>de</strong>l PIB)) 19,7 19,3 27,9 28,4 27,2 23,1Deuda Externa (% <strong>de</strong> las Exportaciones) 53,1 91,4 76,1 76,2 73,6 74,1Deuda Neta (US$ MMM) (53,2) (53,4) (53,7) (54,4) (52,3) (50,4)Tasa <strong>de</strong> Servicio <strong>de</strong> Deuda b/ 5,2 9,1 7,6 7,7 7,1 6,9Balanza <strong>de</strong> PagosPrecio <strong>de</strong>l Petróleo (Brent) 106,5 55,5 67,9 65,0 70,0 72,0Precio <strong>de</strong>l Petróleo (Cesta Venezolana) 92,5 48,5 59,3 57,1 61,1 62,0Diferencial 86,9% 87,4% 87,3% 87,8% 87,3% 86,1%Cuenta Corriente (% PIB) 9,3 0,6 9,0 6,1 6,0 5,5Cuenta Corriente (US$ MMM) 28,3 2,0 21,1 14,4 15,4 16,5Balanza Comercial (US$ MMM) 34,2 7,8 25,8 20,4 20,5 20,7Exportaciones (US$ MMM) 87,0 50,3 60,0 59,0 64,0 66,2Exportaciones Petroleras (bl/dia) 2,40 2,45 2,50 2,55 2,60 2,65Importaciones (US$ MMM) (52,8) (42,5) (34,2) (38,6) (43,5) (45,5)Balanza <strong>de</strong> Servicios y Transferencias (US$ MMM) (5,9) (5,8) (4,7) (6,1) (5,1) (4,2)Cuenta <strong>de</strong> Capital (US$ MMM) (23,6) (14,9) (19,2) (12,4) (12,9) (13,0)Inversión Extranjera Directa (US$ MMM) 1,1 1,2 1,3 1,6 1,5 1,5Mercado <strong>de</strong> trabajoDesempleo (%) 7,5 11,0 13,1 13,5 13,0 11,9Cambio <strong>de</strong> Salarios Reales (% Anual) 8,7 (10,7) (13,3) (5,5) (1,8) 2,6(a) (Amort + Deficit fiscal). (b) (Amort+Interes Deuda Externa)/Exportacion <strong>de</strong> bienes y servicios.Fuentes: Ministerio <strong>de</strong> Finanzas, Oficina <strong>de</strong> Presupuesto, Banco Central <strong>de</strong> Venezuela, Instituto Nacional <strong>de</strong> Estadísticas y Ecoanalítica