Nigel Holt and Rob Lewis - Crown House Publishing.
Nigel Holt and Rob Lewis - Crown House Publishing.
Nigel Holt and Rob Lewis - Crown House Publishing.

Create successful ePaper yourself
Turn your PDF publications into a flip-book with our unique Google optimized e-Paper software.
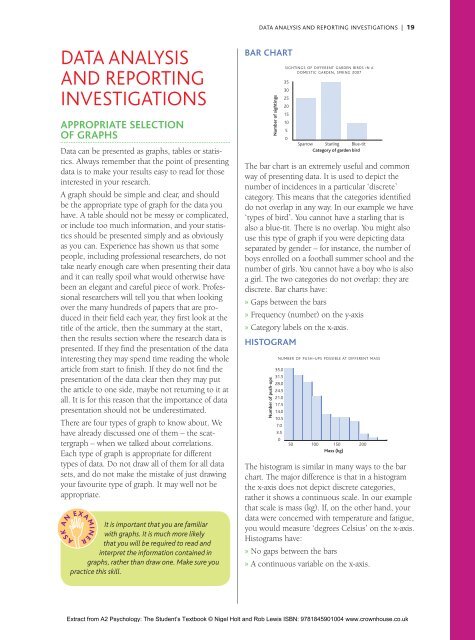
DATA ANALYSIS AND REPORTING INVESTIGATIONS | 19DATA ANALYSISAND REPORTINGINVESTIGATIONSAppropriate selectionof graphsData can be presented as graphs, tables or statistics.Always remember that the point of presentingdata is to make your results easy to read for thoseinterested in your research.A graph should be simple <strong>and</strong> clear, <strong>and</strong> shouldbe the appropriate type of graph for the data youhave. A table should not be messy or complicated,or include too much information, <strong>and</strong> your statisticsshould be presented simply <strong>and</strong> as obviouslyas you can. Experience has shown us that somepeople, including professional researchers, do nottake nearly enough care when presenting their data<strong>and</strong> it can really spoil what would otherwise havebeen an elegant <strong>and</strong> careful piece of work. Professionalresearchers will tell you that when lookingover the many hundreds of papers that are producedin their field each year, they first look at thetitle of the article, then the summary at the start,then the results section where the research data ispresented. If they find the presentation of the datainteresting they may spend time reading the wholearticle from start to finish. If they do not find thepresentation of the data clear then they may putthe article to one side, maybe not returning to it atall. It is for this reason that the importance of datapresentation should not be underestimated.There are four types of graph to know about. Wehave already discussed one of them – the scattergraph– when we talked about correlations.Each type of graph is appropriate for differenttypes of data. Do not draw all of them for all datasets, <strong>and</strong> do not make the mistake of just drawingyour favourite type of graph. It may well not beappropriate.It is important that you are familiarwith graphs. It is much more likelythat you will be required to read <strong>and</strong>interpret the information contained ingraphs, rather than draw one. Make sure youpractice this skill.bar chartNumber of sightingsSIGHTINGS OF DIFFERENT GARDEN BIRDS IN ADOMESTIC GARDEN, SPRING 200735302520151050Sparrow Starling Blue-titCategory of garden birdThe bar chart is an extremely useful <strong>and</strong> commonway of presenting data. It is used to depict thenumber of incidences in a particular ‘discrete’category. This means that the categories identifieddo not overlap in any way. In our example we have‘types of bird’. You cannot have a starling that isalso a blue-tit. There is no overlap. You might alsouse this type of graph if you were depicting dataseparated by gender – for instance, the number ofboys enrolled on a football summer school <strong>and</strong> thenumber of girls. You cannot have a boy who is alsoa girl. The two categories do not overlap: they arediscrete. Bar charts have:»»Gaps between the bars»»Frequency (number) on the y-axis»»Category labels on the x-axis.HistogramNumber of push-upsNUMBER OF PUSH-UPS POSSIBLE AT DIFFERENT MASS35.031.528.024.521.017.514.010.57.03.5050 100 150 200Mass (kg)The histogram is similar in many ways to the barchart. The major difference is that in a histogramthe x-axis does not depict discrete categories,rather it shows a continuous scale. In our examplethat scale is mass (kg). If, on the other h<strong>and</strong>, yourdata were concerned with temperature <strong>and</strong> fatigue,you would measure ‘degrees Celsius’ on the x-axis.Histograms have:»»No gaps between the bars»»A continuous variable on the x-axis.Extract from A2 Psychology: The Student’s Textbook © <strong>Nigel</strong> <strong>Holt</strong> <strong>and</strong> <strong>Rob</strong> <strong>Lewis</strong> ISBN: 9781845901004 www.crownhouse.co.uk