Nigel Holt and Rob Lewis - Crown House Publishing.
Nigel Holt and Rob Lewis - Crown House Publishing.
Nigel Holt and Rob Lewis - Crown House Publishing.

Create successful ePaper yourself
Turn your PDF publications into a flip-book with our unique Google optimized e-Paper software.
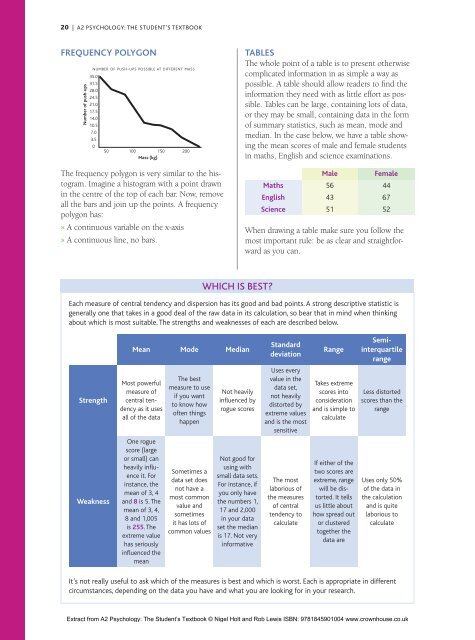
20 | A2 PSYCHOLOGY: THE STUDENT’S TEXTBOOKFrequency polygonNumber of push-upsNUMBER OF PUSH-UPS POSSIBLE AT DIFFERENT MASS35.031.528.024.521.017.514.010.57.03.5050 100 150 200Mass (kg)The frequency polygon is very similar to the histogram.Imagine a histogram with a point drawnin the centre of the top of each bar. Now, removeall the bars <strong>and</strong> join up the points. A frequencypolygon has:»»A continuous variable on the x-axis»»A continuous line, no bars.TablesThe whole point of a table is to present otherwisecomplicated information in as simple a way aspossible. A table should allow readers to find theinformation they need with as little effort as possible.Tables can be large, containing lots of data,or they may be small, containing data in the formof summary statistics, such as mean, mode <strong>and</strong>median. In the case below, we have a table showingthe mean scores of male <strong>and</strong> female studentsin maths, English <strong>and</strong> science examinations.MathsEnglishScienceMale564351Female446752When drawing a table make sure you follow themost important rule: be as clear <strong>and</strong> straightforwardas you can.Which is best?Each measure of central tendency <strong>and</strong> dispersion has its good <strong>and</strong> bad points. A strong descriptive statistic isgenerally one that takes in a good deal of the raw data in its calculation, so bear that in mind when thinkingabout which is most suitable. The strengths <strong>and</strong> weaknesses of each are described below.StrengthWeaknessMeanMost powerfulmeasure ofcentral tendencyas it usesall of the dataOne roguescore (largeor small) canheavily influenceit. Forinstance, themean of 3, 4<strong>and</strong> 8 is 5. Themean of 3, 4,8 <strong>and</strong> 1,005is 255. Theextreme valuehas seriouslyinfluenced themeanModeThe bestmeasure to useif you wantto know howoften thingshappenSometimes adata set doesnot have amost commonvalue <strong>and</strong>sometimesit has lots ofcommon valuesMedianNot heavilyinfluenced byrogue scoresNot good forusing withsmall data sets.For instance, ifyou only havethe numbers 1,17 <strong>and</strong> 2,000in your dataset the medianis 17. Not veryinformativeSt<strong>and</strong>arddeviationUses everyvalue in thedata set,not heavilydistorted byextreme values<strong>and</strong> is the mostsensitiveThe mostlaborious ofthe measuresof centraltendency tocalculateRangeTakes extremescores intoconsideration<strong>and</strong> is simple tocalculateIf either of thetwo scores areextreme, rangewill be distorted.It tellsus little abouthow spread outor clusteredtogether thedata areSemiinterquartilerangeLess distortedscores than therangeUses only 50%of the data inthe calculation<strong>and</strong> is quitelaborious tocalculateIt’s not really useful to ask which of the measures is best <strong>and</strong> which is worst. Each is appropriate in differentcircumstances, depending on the data you have <strong>and</strong> what you are looking for in your research.Extract from A2 Psychology: The Student’s Textbook © <strong>Nigel</strong> <strong>Holt</strong> <strong>and</strong> <strong>Rob</strong> <strong>Lewis</strong> ISBN: 9781845901004 www.crownhouse.co.uk