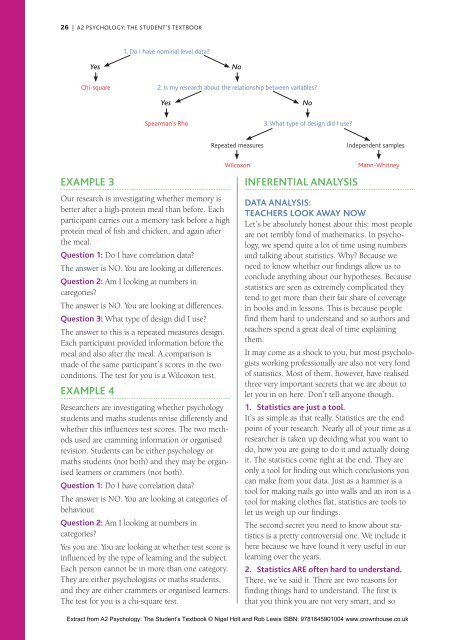
26 | A2 PSYCHOLOGY: THE STUDENT’S TEXTBOOK1. Do I have nominal level data?YesNoChi-square2. Is my research about the relationship between variables?YesNoSpearman’s Rho3. What type of design did I use?Repeated measuresIndependent samplesExample 3Our research is investigating whether memory isbetter after a high-protein meal than before. Eachparticipant carries out a memory task before a highprotein meal of fish <strong>and</strong> chicken, <strong>and</strong> again afterthe meal.Question 1: Do I have correlation data?The answer is NO. You are looking at differences.Question 2: Am I looking at numbers incategories?The answer is NO. You are looking at differences.Question 3: What type of design did I use?The answer to this is a repeated measures design.Each participant provided information before themeal <strong>and</strong> also after the meal. A comparison ismade of the same participant’s scores in the twoconditions. The test for you is a Wilcoxon test.Example 4Researchers are investigating whether psychologystudents <strong>and</strong> maths students revise differently <strong>and</strong>whether this influences test scores. The two methodsused are cramming information or organisedrevision. Students can be either psychology ormaths students (not both) <strong>and</strong> they may be organisedlearners or crammers (not both).Question 1: Do I have correlation data?The answer is NO. You are looking at categories ofbehaviour.Question 2: Am I looking at numbers incategories?Yes you are. You are looking at whether test score isinfluenced by the type of learning <strong>and</strong> the subject.Each person cannot be in more than one category.They are either psychologists or maths students,<strong>and</strong> they are either crammers or organised learners.The test for you is a chi-square test.WilcoxonInferential analysisMann-WhitneyData analysis:teachers LOOK AWAY NOWLet’s be absolutely honest about this: most peopleare not terribly fond of mathematics. In psychology,we spend quite a lot of time using numbers<strong>and</strong> talking about statistics. Why? Because weneed to know whether our findings allow us toconclude anything about our hypotheses. Becausestatistics are seen as extremely complicated theytend to get more than their fair share of coveragein books <strong>and</strong> in lessons. This is because peoplefind them hard to underst<strong>and</strong> <strong>and</strong> so authors <strong>and</strong>teachers spend a great deal of time explainingthem.It may come as a shock to you, but most psychologistsworking professionally are also not very fondof statistics. Most of them, however, have realisedthree very important secrets that we are about tolet you in on here. Don’t tell anyone though.1. Statistics are just a tool.It’s as simple as that really. Statistics are the endpoint of your research. Nearly all of your time as aresearcher is taken up deciding what you want todo, how you are going to do it <strong>and</strong> actually doingit. The statistics come right at the end. They areonly a tool for finding out which conclusions youcan make from your data. Just as a hammer is atool for making nails go into walls <strong>and</strong> an iron is atool for making clothes flat, statistics are tools tolet us weigh up our findings.The second secret you need to know about statisticsis a pretty controversial one. We include ithere because we have found it very useful in ourlearning over the years.2. Statistics ARE often hard to underst<strong>and</strong>.There, we’ve said it. There are two reasons forfinding things hard to underst<strong>and</strong>. The first isthat you think you are not very smart, <strong>and</strong> soExtract from A2 Psychology: The Student’s Textbook © <strong>Nigel</strong> <strong>Holt</strong> <strong>and</strong> <strong>Rob</strong> <strong>Lewis</strong> ISBN: 9781845901004 www.crownhouse.co.uk
DATA ANALYSIS AND REPORTING INVESTIGATIONS | 27if something is tricky, then it’s your fault. Thesecond, just as valid, reason that something seemshard is that it IS hard. Anyone who tells you thatstatistics are always simple would be lying to you.They do require some thought. However, thereason most people find them hard is neatly sidesteppedwhen we let you in on secret number 3.3. You do not have to underst<strong>and</strong> it all.At this point, teachers all over the country arefainting with the realisation that this, the mostcontroversial of their secrets, has been told totheir students. Here’s an example of what wemean: stick with us here, it’s worth it. Sometimespsychologists may use equations when workingsomething out. In these equations they may needto divide by things, multiply numbers or add alot of numbers up. Here’s where secret number 3comes in.The reason many students setting out to learnhow to use statistics in psychology find it hard isbecause they are naturally thoughtful <strong>and</strong> inquisitivepeople. They are used to asking questions like“WHY am I doing this?” <strong>and</strong> “WHY do I need todivide by this number?” The problem is that theanswers to these questions are often much morecomplicated that you might expect, <strong>and</strong> so the studentpsychologist can become bogged down <strong>and</strong>sometimes confused. They learn that statistics canbe hard <strong>and</strong> confusing <strong>and</strong> then everything thatinvolves them is to be hated <strong>and</strong> avoided.Now, rewind a little. What might have happened ifthe student psychologist had not asked the WHYquestions? If they had not needed to know whysomething needed to be divided by somethingelse? In fact, in many cases, most psychologistsdo not know why certain things are done whenapplying the tests, they just do them. Here’s themost controversial tip of all. Just for the moment,<strong>and</strong> just where following instructions on statisticsare concerned, switch off the bit of your brainthat makes you ask ‘Why?’ Just do it, in the firmknowledge that it works. Remember, statisticsare a tool, just like any other. You do not need tounderst<strong>and</strong> the physics that go along with the actof hammering a nail into a wall do you? You do notconsult textbooks to underst<strong>and</strong> how the thermostatworks in an iron when smoothing your clothesdo you? Then don’t worry about why we divideby something, or why you are told to multiply twonumbers together.An often overused but really good example is cakemaking. Following a tried <strong>and</strong> tested recipe onestep at a time will result in a good cake. Changingthe recipe might improve the cake, but it maywell ruin it, so it’s safer to stick to the recipe as italways gives successful results. Cooking is basicallychemistry with food. When you mix thingstogether <strong>and</strong> apply heat you change the structureof the ingredients, turning them magically intowonderful cakey goodness. You do not need to bean expert in molecular chemistry to know howto make a cake. You do not need to know howmolecules are broken <strong>and</strong> re-formed during thecooking process <strong>and</strong> why these molecules areeasy to digest. You do not ask ‘why’ questions incake making, so there is no need to ask them instatistics.We have been as careful as we can to set out thestatistics you need to know in a form that is easyto follow <strong>and</strong> reproduce. Where appropriate we’lltell you what’s happening <strong>and</strong> why, but the ruleis, if you follow each step carefully you will beprovided with the information you need in yourresearch.Using inferential statisticsDescriptive statistics allow us to describe the datawe are using. They include presenting data in theform of graphs <strong>and</strong> tables or summarising themas measures of central tendency or dispersion. Inthis section we will describe how to carry out fourdifferent statistical tests that allow us to infer somethingabout our data. By that we mean that theyallow us to deduce or conclude something aboutthe research we have carried out, not just describethe data. Inferential statistics are often usedright at the end of the research process to allowresearchers to conclude things about whether theirresults have occurred by chance or not. Remember,the tests are only tools to allow you to arrive ata p value for your research. The various tests mayseem a little confusing at first, but stick with it,<strong>and</strong> they will become much easier to h<strong>and</strong>le.You are required to know about the useof four inferential tests: Spearman’sRho, Wilcoxon, Mann-Whitney <strong>and</strong> chisquare.Don’t learn every step of eachtest – instead, develop an appreciation ofthe logic of inferential analysis. Underst<strong>and</strong> why youwould use a particular test, how the score from eachtest leads to a p value <strong>and</strong> how this is interpreted forsignificance. A good underst<strong>and</strong>ing of these thingswill serve you well in the exam.Extract from A2 Psychology: The Student’s Textbook © <strong>Nigel</strong> <strong>Holt</strong> <strong>and</strong> <strong>Rob</strong> <strong>Lewis</strong> ISBN: 9781845901004 www.crownhouse.co.uk