Nigel Holt and Rob Lewis - Crown House Publishing.
Nigel Holt and Rob Lewis - Crown House Publishing.
Nigel Holt and Rob Lewis - Crown House Publishing.

You also want an ePaper? Increase the reach of your titles
YUMPU automatically turns print PDFs into web optimized ePapers that Google loves.
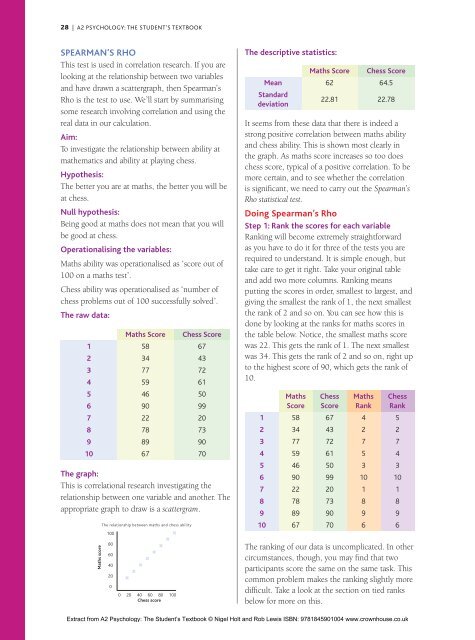
28 | A2 PSYCHOLOGY: THE STUDENT’S TEXTBOOKSpearman’s RhoThis test is used in correlation research. If you arelooking at the relationship between two variables<strong>and</strong> have drawn a scattergraph, then Spearman’sRho is the test to use. We’ll start by summarisingsome research involving correlation <strong>and</strong> using thereal data in our calculation.Aim:To investigate the relationship between ability atmathematics <strong>and</strong> ability at playing chess.Hypothesis:The better you are at maths, the better you will beat chess.Null hypothesis:Being good at maths does not mean that you willbe good at chess.Operationalising the variables:Maths ability was operationalised as ‘score out of100 on a maths test’.Chess ability was operationalised as ‘number ofchess problems out of 100 successfully solved’.The raw data:12345678910Maths Score58347759469022788967Chess Score67437261509920739070The graph:This is correlational research investigating therelationship between one variable <strong>and</strong> another. Theappropriate graph to draw is a scattergram.The relationship between maths <strong>and</strong> chess ability1008060402000 20 40 60 80 100Chess scoreMaths scoreThe descriptive statistics:MeanSt<strong>and</strong>arddeviationMaths Score6222.81Chess Score64.522.78It seems from these data that there is indeed astrong positive correlation between maths ability<strong>and</strong> chess ability. This is shown most clearly inthe graph. As maths score increases so too doeschess score, typical of a positive correlation. To bemore certain, <strong>and</strong> to see whether the correlationis significant, we need to carry out the Spearman’sRho statistical test.Doing Spearman’s RhoStep 1: Rank the scores for each variableRanking will become extremely straightforwardas you have to do it for three of the tests you arerequired to underst<strong>and</strong>. It is simple enough, buttake care to get it right. Take your original table<strong>and</strong> add two more columns. Ranking meansputting the scores in order, smallest to largest, <strong>and</strong>giving the smallest the rank of 1, the next smallestthe rank of 2 <strong>and</strong> so on. You can see how this isdone by looking at the ranks for maths scores inthe table below. Notice, the smallest maths scorewas 22. This gets the rank of 1. The next smallestwas 34. This gets the rank of 2 <strong>and</strong> so on, right upto the highest score of 90, which gets the rank of10.12345678910MathsScore58347759469022788967ChessScore67437261509920739070MathsRank42753101896ChessRank52743101896The ranking of our data is uncomplicated. In othercircumstances, though, you may find that twoparticipants score the same on the same task. Thiscommon problem makes the ranking slightly moredifficult. Take a look at the section on tied ranksbelow for more on this.Extract from A2 Psychology: The Student’s Textbook © <strong>Nigel</strong> <strong>Holt</strong> <strong>and</strong> <strong>Rob</strong> <strong>Lewis</strong> ISBN: 9781845901004 www.crownhouse.co.uk