Nigel Holt and Rob Lewis - Crown House Publishing.
Nigel Holt and Rob Lewis - Crown House Publishing.
Nigel Holt and Rob Lewis - Crown House Publishing.

You also want an ePaper? Increase the reach of your titles
YUMPU automatically turns print PDFs into web optimized ePapers that Google loves.
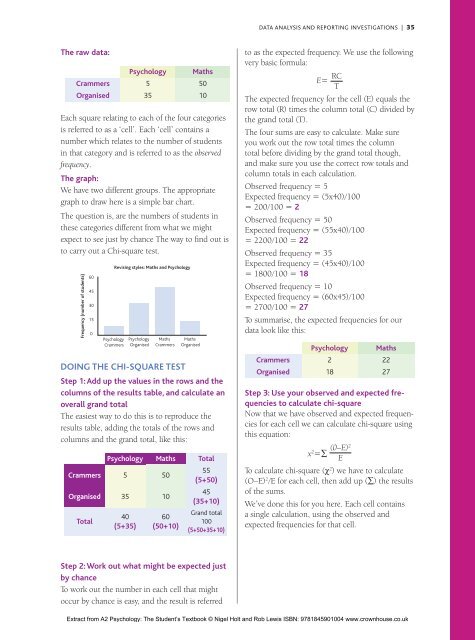
DATA ANALYSIS AND REPORTING INVESTIGATIONS | 35The raw data:CrammersOrganisedPsychology535MathsEach square relating to each of the four categoriesis referred to as a ‘cell’. Each ‘cell’ contains anumber which relates to the number of studentsin that category <strong>and</strong> is referred to as the observedfrequency.The graph:We have two different groups. The appropriategraph to draw here is a simple bar chart.The question is, are the numbers of students inthese categories different from what we mightexpect to see just by chance The way to find out isto carry out a Chi-square test.Frequency (number of students)604530150PsychologyCrammersRevising styles: Maths <strong>and</strong> PsychologyPsychologyOrganisedMathsCrammersDoing the chi-square testMathsOrganisedStep 1: Add up the values in the rows <strong>and</strong> thecolumns of the results table, <strong>and</strong> calculate anoverall gr<strong>and</strong> totalThe easiest way to do this is to reproduce theresults table, adding the totals of the rows <strong>and</strong>columns <strong>and</strong> the gr<strong>and</strong> total, like this:CrammersOrganisedTotalPsychology53540(5+35)Maths501060(50+10)5010Total55(5+50)45(35+10)Gr<strong>and</strong> total100(5+50+35+10)to as the expected frequency. We use the followingvery basic formula:RCE=TThe expected frequency for the cell (E) equals therow total (R) times the column total (C) divided bythe gr<strong>and</strong> total (T).The four sums are easy to calculate. Make sureyou work out the row total times the columntotal before dividing by the gr<strong>and</strong> total though,<strong>and</strong> make sure you use the correct row totals <strong>and</strong>column totals in each calculation.Observed frequency = 5Expected frequency = (5x40)/100= 200/100 = 2Observed frequency = 50Expected frequency = (55x40)/100= 2200/100 = 22Observed frequency = 35Expected frequency = (45x40)/100= 1800/100 = 18Observed frequency = 10Expected frequency = (60x45)/100= 2700/100 = 27To summarise, the expected frequencies for ourdata look like this:CrammersOrganisedPsychology218Maths2227Step 3: Use your observed <strong>and</strong> expected frequenciesto calculate chi-squareNow that we have observed <strong>and</strong> expected frequenciesfor each cell we can calculate chi-square usingthis equation:(0–E) 2x 2 =∑ETo calculate chi-square (c 2 ) we have to calculate(O–E) 2 /E for each cell, then add up (∑) the resultsof the sums.We’ve done this for you here. Each cell containsa single calculation, using the observed <strong>and</strong>expected frequencies for that cell.Step 2: Work out what might be expected justby chanceTo work out the number in each cell that mightoccur by chance is easy, <strong>and</strong> the result is referredExtract from A2 Psychology: The Student’s Textbook © <strong>Nigel</strong> <strong>Holt</strong> <strong>and</strong> <strong>Rob</strong> <strong>Lewis</strong> ISBN: 9781845901004 www.crownhouse.co.uk