News letter Dam edition
News letter Dam edition
News letter Dam edition
- No tags were found...

You also want an ePaper? Increase the reach of your titles
YUMPU automatically turns print PDFs into web optimized ePapers that Google loves.
Ingeokring <strong>News</strong><strong>letter</strong><br />
Parameters standard<br />
Circumstances Dip PCS average (8)<br />
Processes<br />
Gravity<br />
Dip PCS high (9)<br />
Dip PCS low (5)<br />
Parameters low<br />
Parameters<br />
standard<br />
1.70 1.44 1.95 1.67<br />
Dyke elastic infill 1.63 1.34 NA NA<br />
Dyke ‘magma’ infill see text see text - -<br />
Dyke no infill 1.27 1.07 - -<br />
Pore pressures riftzone see text see text - -<br />
Future Growth + 200m 1.64 1.40 - -<br />
Future Growth + 400m 1.55 1.32 - -<br />
Future Growth + 600m 1.46 1.23 - -<br />
Future Growth + 800m 1.41 1.19 - -<br />
Future Growth + 1000m 1.33 1.12 - -<br />
Massive flank collapse at La Palma: numerical slope stability<br />
models of the Cumbre Vieja volcano<br />
Janneke van Berlo<br />
In 1999, Steven Ward and Simon Day launched a scientific<br />
article which discussed possible tsunami effects in the USA<br />
as a result of a massive flank collapse of the Cumbre Vieja<br />
volcano at La Palma. One problem of their hypothesis is that<br />
the slope instability has not been investigated in a quantitative<br />
way. The research question therefore aims to partially<br />
solve this problem: “Under what boundary conditions could<br />
the Western flank of the Cumbre Vieja volcano start sliding and<br />
at what recurrent times would such mass movement occur?”<br />
Methodology concentrates on integrally modelling three<br />
model attributes (geometry, material and processes) in a<br />
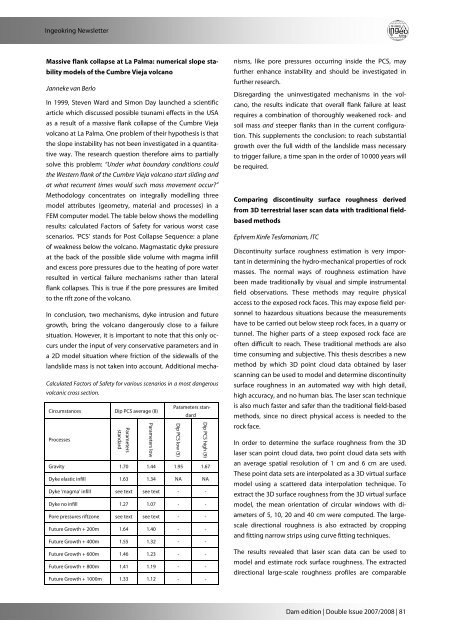
FEM computer model. The table below shows the modelling<br />
results: calculated Factors of Safety for various worst case<br />
scenarios. ‘PCS’ stands for Post Collapse Sequence: a plane<br />
of weakness below the volcano. Magmastatic dyke pressure<br />
at the back of the possible slide volume with magma infill<br />
and excess pore pressures due to the heating of pore water<br />
resulted in vertical failure mechanisms rather than lateral<br />
flank collapses. This is true if the pore pressures are limited<br />
to the rift zone of the volcano.<br />
In conclusion, two mechanisms, dyke intrusion and future<br />
growth, bring the volcano dangerously close to a failure<br />
situation. However, it is important to note that this only occurs<br />
under the input of very conservative parameters and in<br />
a 2D model situation where friction of the sidewalls of the<br />
landslide mass is not taken into account. Additional mecha-<br />
Calculated Factors of Safety for various scenarios in a most dangerous<br />
volcanic cross section.<br />
nisms, like pore pressures occurring inside the PCS, may<br />
further enhance instability and should be investigated in<br />
further research.<br />
Disregarding the uninvestigated mechanisms in the volcano,<br />
the results indicate that overall flank failure at least<br />
requires a combination of thoroughly weakened rock- and<br />
soil mass and steeper flanks than in the current configuration.<br />
This supplements the conclusion: to reach substantial<br />
growth over the full width of the landslide mass necessary<br />
to trigger failure, a time span in the order of 10 000 years will<br />
be required.<br />
Comparing discontinuity surface roughness derived<br />
from 3D terrestrial laser scan data with traditional fieldbased<br />
methods<br />
Ephrem Kinfe Tesfamariam, ITC<br />
Discontinuity surface roughness estimation is very important<br />
in determining the hydro-mechanical properties of rock<br />
masses. The normal ways of roughness estimation have<br />
been made traditionally by visual and simple instrumental<br />
field observations. These methods may require physical<br />
access to the exposed rock faces. This may expose field personnel<br />
to hazardous situations because the measurements<br />
have to be carried out below steep rock faces, in a quarry or<br />
tunnel. The higher parts of a steep exposed rock face are<br />
often difficult to reach. These traditional methods are also<br />
time consuming and subjective. This thesis describes a new<br />
method by which 3D point cloud data obtained by laser<br />
scanning can be used to model and determine discontinuity<br />
surface roughness in an automated way with high detail,<br />
high accuracy, and no human bias. The laser scan technique<br />
is also much faster and safer than the traditional field-based<br />
methods, since no direct physical access is needed to the<br />
rock face.<br />
In order to determine the surface roughness from the 3D<br />
laser scan point cloud data, two point cloud data sets with<br />
an average spatial resolution of 1 cm and 6 cm are used.<br />
These point data sets are interpolated as a 3D virtual surface<br />
model using a scattered data interpolation technique. To<br />
extract the 3D surface roughness from the 3D virtual surface<br />
model, the mean orientation of circular windows with diameters<br />
of 5, 10, 20 and 40 cm were computed. The largescale<br />
directional roughness is also extracted by cropping<br />
and fitting narrow strips using curve fitting techniques.<br />
The results revealed that laser scan data can be used to<br />
model and estimate rock surface roughness. The extracted<br />
directional large-scale roughness profiles are comparable<br />
<strong>Dam</strong> <strong>edition</strong> | Double Issue 2007/2008 | 81