012 - ÄEZ Distribuce
012 - ÄEZ Distribuce
012 - ÄEZ Distribuce
- No tags were found...

Create successful ePaper yourself
Turn your PDF publications into a flip-book with our unique Google optimized e-Paper software.
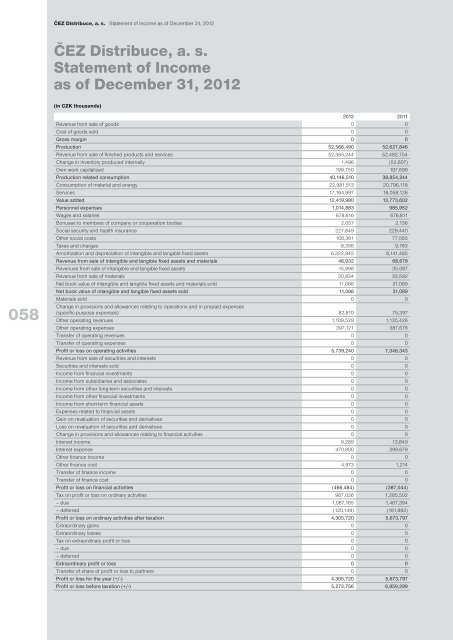
ČEZ <strong>Distribuce</strong>, a. s. Statement of Income as of December 31, 2<strong>012</strong><br />
ČEZ <strong>Distribuce</strong>, a. s.<br />
Statement of Income<br />
as of December 31, 2<strong>012</strong><br />
(in CZK thousands)<br />
058<br />
2<strong>012</strong> 2011<br />
Revenue from sale of goods 0 0<br />
Cost of goods sold 0 0<br />
Gross margin 0 0<br />
Production 52,566,490 52,627,846<br />
Revenue from sale of finished products and services 52,365,244 52,482,754<br />
Change in inventory produced internally 1,496 (52,607)<br />
Own work capitalized 199,750 197,699<br />
Production related consumption 40,146,510 38,854,244<br />
Consumption of material and energy 22,981,513 20,796,118<br />
Services 17,164,997 18,058,126<br />
Value added 12,419,980 13,773,602<br />
Personnel expenses 1,014,883 985,952<br />
Wages and salaries 678,616 676,811<br />
Bonuses to members of company or cooperation bodies 2,057 2,136<br />
Social security and health insurance 227,849 229,440<br />
Other social costs 106,361 77,565<br />
Taxes and charges 8,356 9,763<br />
Amortization and depreciation of intangible and tangible fixed assets 6,322,945 6,141,485<br />
Revenue from sale of intangible and tangible fixed assets and materials 46,932 68,679<br />
Revenues from sale of intangible and tangible fixed assets 15,998 35,087<br />
Revenue from sale of materials 30,934 33,592<br />
Net book value of intangible and tangible fixed assets and materials sold 11,086 31,089<br />
Net book value of intangible and tangible fixed assets sold 11,086 31,089<br />
Materials sold 0 0<br />
Change in provisions and allowances relating to operations and in prepaid expenses<br />
(specific-purpose expenses) 82,810 75,397<br />
Other operating revenues 1,109,529 1,135,426<br />
Other operating expenses 397,121 387,678<br />
Transfer of operating revenues 0 0<br />
Transfer of operating expenses 0 0<br />
Profit or loss on operating activities 5,739,240 7,346,343<br />
Revenue from sale of securities and interests 0 0<br />
Securities and interests sold 0 0<br />
Income from financial investments 0 0<br />
Income from subsidiaries and associates 0 0<br />
Income from other long-term securities and interests 0 0<br />
Income from other financial investments 0 0<br />
Income from short-term financial assets 0 0<br />
Expenses related to financial assets 0 0<br />
Gain on revaluation of securities and derivatives 0 0<br />
Loss on revaluation of securities and derivatives 0 0<br />
Change in provisions and allowances relating to financial activities 0 0<br />
Interest income 9,289 13,849<br />
Interest expense 470,800 399,679<br />
Other finance income 0 0<br />
Other finance cost 4,973 1,214<br />
Transfer of finance income 0 0<br />
Transfer of finance cost 0 0<br />
Profit or loss on financial activities (466,484) (387,044)<br />
Tax on profit or loss on ordinary activities 967,036 1,285,502<br />
– due 1,087,185 1,467,394<br />
– deferred (120,149) (181,892)<br />
Profit or loss on ordinary activities after taxation 4,305,720 5,673,797<br />
Extraordinary gains 0 0<br />
Extraordinary losses 0 0<br />
Tax on extraordinary profit or loss 0 0<br />
– due 0 0<br />
– deferred 0 0<br />
Extraordinary profit or loss 0 0<br />
Transfer of share of profit or loss to partners 0 0<br />
Profit or loss for the year (+/-) 4,305,720 5,673,797<br />
Profit or loss before taxation (+/-) 5,272,756 6,959,299