mathematics
Mathematics 2001.pdf [33.7 MB] - NEMP - University of Otago
Mathematics 2001.pdf [33.7 MB] - NEMP - University of Otago
- No tags were found...

Create successful ePaper yourself
Turn your PDF publications into a flip-book with our unique Google optimized e-Paper software.
Chapter 3: Number 15<br />
trend<br />
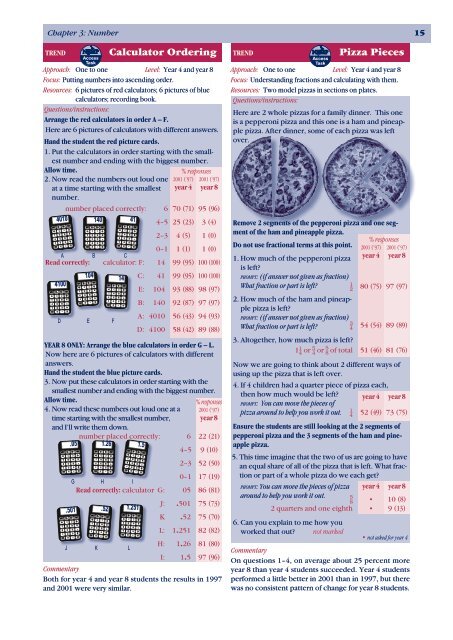
Calculator Ordering<br />
trend<br />
Pizza Pieces<br />
Approach: One to one Level: Year 4 and year 8<br />
Focus: Putting numbers into ascending order.<br />
Resources: 6 pictures of red calculators; 6 pictures of blue<br />
calculators; recording book.<br />
Questions/instructions:<br />
Arrange the red calculators in order A – F.<br />
Here are 6 pictures of calculators with different answers.<br />
Hand the student the red picture cards.<br />
1. Put the calculators in order starting with the smallest<br />
number and ending with the biggest number.<br />
Allow time.<br />
2. Now read the numbers out loud one<br />
at a time starting with the smallest<br />
number.<br />
4010<br />
41<br />
% responses<br />
2001 (’97) 2001 (’97)<br />
year 4 year 8<br />
0–1 1 (1) 1 (0)<br />
A B C<br />
Read correctly: calculator: F: 14 99 (95) 100 (100)<br />
4100<br />
number placed correctly: 6 70 (71) 95 (96)<br />
D E F<br />
J<br />
.05<br />
104<br />
140<br />
% responses<br />
2001 (’97)<br />
year 8<br />
number placed correctly: 6 22 (21)<br />
1.5<br />
4–5 9 (10)<br />
0–1 17 (19)<br />
G H I<br />
Read correctly: calculator G: 05 86 (81)<br />
.501<br />
K<br />
1.26<br />
.52<br />
14<br />
1.251<br />
L<br />
Commentary<br />
Both for year 4 and year 8 students the results in 1997<br />
and 2001 were very similar.<br />
1.5<br />
4–5 25 (23) 3 (4)<br />
2–3 4 (5) 1 (0)<br />
C: 41 99 (95) 100 (100)<br />
E: 104 93 (88) 98 (97)<br />
B: 140 92 (87) 97 (97)<br />
A: 4010 56 (43) 94 (93)<br />
D: 4100 58 (42) 89 (88)<br />
year 8 only: Arrange the blue calculators in order G – L.<br />
Now here are 6 pictures of calculators with different<br />
answers.<br />
Hand the student the blue picture cards.<br />
3. Now put these calculators in order starting with the<br />
smallest number and ending with the biggest number.<br />
Allow time.<br />
4. Now read these numbers out loud one at a<br />
time starting with the smallest number,<br />
and I’ll write them down.<br />
2–3 52 (50)<br />
J: .501 75 (73)<br />
K .52 75 (70)<br />
L: 1.251 82 (82)<br />
H: 1.26 81 (80)<br />
I: 1.5 97 (96)<br />
Approach: One to one Level: Year 4 and year 8<br />
Focus: Understanding fractions and calculating with them.<br />
Resources: Two model pizzas in sections on plates.<br />
Questions/instructions:<br />
Here are 2 whole pizzas for a family dinner. This one<br />
is a pepperoni pizza and this one is a ham and pineapple<br />
pizza. After dinner, some of each pizza was left<br />
over.<br />
Remove 2 segments of the pepperoni pizza and one segment<br />
of the ham and pineapple pizza.<br />
Do not use fractional terms at this point.<br />
1. How much of the pepperoni pizza<br />
is left?<br />
prompt: (if answer not given as fraction)<br />
What fraction or part is left?<br />
2. How much of the ham and pineapple<br />
pizza is left?<br />
prompt: (if answer not given as fraction)<br />
What fraction or part is left?<br />
% responses<br />
2001 (’97) 2001 (’97)<br />
year 4 year 8<br />
3. Altogether, how much pizza is left?<br />
1 or or of total 51 (46) 81 (76)<br />
Now we are going to think about 2 different ways of<br />
using up the pizza that is left over.<br />
4. If 4 children had a quarter piece of pizza each,<br />
then how much would be left? year 4 year 8<br />
prompt: You can move the pieces of<br />
pizza around to help you work it out. 52 (49) 73 (75)<br />
Ensure the students are still looking at the 2 segments of<br />
pepperoni pizza and the 3 segments of the ham and pineapple<br />
pizza.<br />
5. This time imagine that the two of us are going to have<br />
an equal share of all of the pizza that is left. What fraction<br />
or part of a whole pizza do we each get?<br />
prompt: You can move the pieces of pizza year 4 year 8<br />
around to help you work it out.<br />
• 10 (8)<br />
2 quarters and one eighth • 9 (13)<br />
6. Can you explain to me how you<br />
worked that out? not marked<br />
80 (75) 97 (97)<br />
54 (54) 89 (89)<br />
• not asked for year 4<br />
Commentary<br />
On questions 1–4, on average about 25 percent more<br />
year 8 than year 4 students succeeded. Year 4 students<br />
performed a little better in 2001 than in 1997, but there<br />
was no consistent pattern of change for year 8 students.