mathematics
Mathematics 2001.pdf [33.7 MB] - NEMP - University of Otago
Mathematics 2001.pdf [33.7 MB] - NEMP - University of Otago
- No tags were found...

You also want an ePaper? Increase the reach of your titles
YUMPU automatically turns print PDFs into web optimized ePapers that Google loves.
72 NEMP Report 23: Mathematics 2001<br />
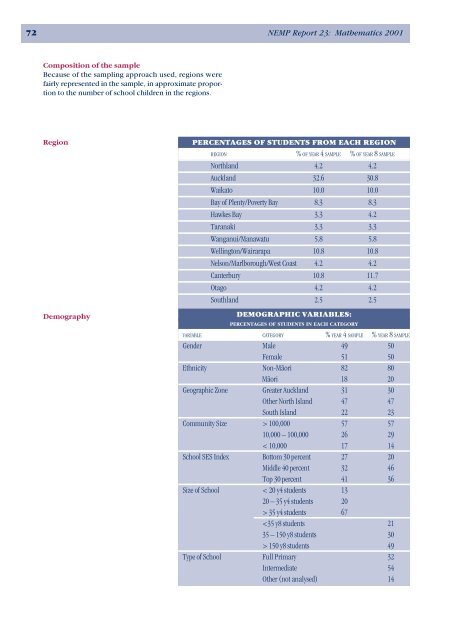
Composition of the sample<br />
Because of the sampling approach used, regions were<br />
fairly represented in the sample, in approximate proportion<br />
to the number of school children in the regions.<br />
Region<br />
Percentages of students from each region<br />
region % of year 4 sample % of year 8 sample<br />
Northland 4.2 4.2<br />
Auckland 32.6 30.8<br />
Waikato 10.0 10.0<br />
Bay of Plenty/Poverty Bay 8.3 8.3<br />
Hawkes Bay 3.3 4.2<br />
Taranaki 3.3 3.3<br />
Wanganui/Manawatu 5.8 5.8<br />
Wellington/Wairarapa 10.8 10.8<br />
Nelson/Marlborough/West Coast 4.2 4.2<br />
Canterbury 10.8 11.7<br />
Otago 4.2 4.2<br />
Southland 2.5 2.5<br />
Demography<br />
demographic variables:<br />
p e r c e n t a g e s o f s t u d e n t s in e a c h c a t e g o r y<br />
variable category % year 4 sample % year 8 sample<br />
Gender Male 49 50<br />
Female 51 50<br />
Ethnicity Non-Māori 82 80<br />
Māori 18 20<br />
Geographic Zone Greater Auckland 31 30<br />
Other North Island 47 47<br />
South Island 22 23<br />
Community Size > 100,000 57 57<br />
10,000 – 100,000 26 29<br />
< 10,000 17 14<br />
School SES Index Bottom 30 percent 27 20<br />
Middle 40 percent 32 46<br />
Top 30 percent 41 36<br />
Size of School < 20 y4 students 13<br />
20 – 35 y4 students 20<br />
> 35 y4 students 67<br />
150 y8 students 49<br />
Type of School Full Primary 32<br />
Intermediate 54<br />
Other (not analysed) 14