mathematics
Mathematics 2001.pdf [33.7 MB] - NEMP - University of Otago
Mathematics 2001.pdf [33.7 MB] - NEMP - University of Otago
- No tags were found...

Create successful ePaper yourself
Turn your PDF publications into a flip-book with our unique Google optimized e-Paper software.
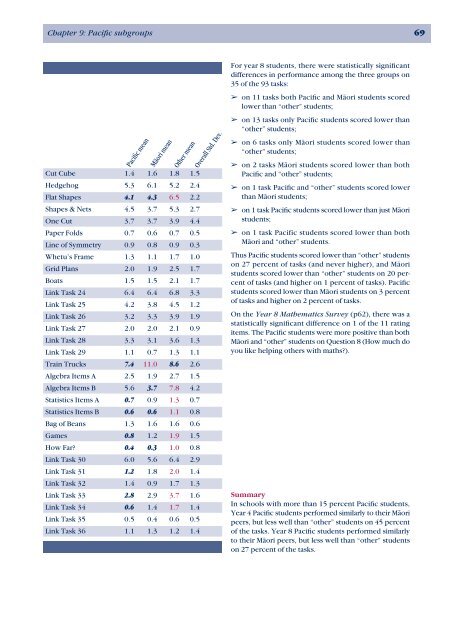
Chapter 9: Pacific subgroups 69<br />
Cut Cube 1.4 1.6 1.8 1.5<br />
Hedgehog 5.3 6.1 5.2 2.4<br />
Flat Shapes 4.1 4.3 6.5 2.2<br />
Shapes & Nets 4.5 3.7 5.3 2.7<br />
One Cut 3.7 3.7 3.9 4.4<br />
Paper Folds 0.7 0.6 0.7 0.5<br />
Line of Symmetry 0.9 0.8 0.9 0.3<br />
Whetu’s Frame 1.3 1.1 1.7 1.0<br />
Grid Plans 2.0 1.9 2.5 1.7<br />
Boats 1.5 1.5 2.1 1.7<br />
Link Task 24 6.4 6.4 6.8 3.3<br />
Link Task 25 4.2 3.8 4.5 1.2<br />
Link Task 26 3.2 3.3 3.9 1.9<br />
Link Task 27 2.0 2.0 2.1 0.9<br />
Link Task 28 3.3 3.1 3.6 1.3<br />
Link Task 29 1.1 0.7 1.3 1.1<br />
Train Trucks 7.4 11.0 8.6 2.6<br />
Algebra Items A 2.5 1.9 2.7 1.5<br />
Algebra Items B 5.6 3.7 7.8 4.2<br />
Statistics Items A 0.7 0.9 1.3 0.7<br />
Statistics Items B 0.6 0.6 1.1 0.8<br />
Bag of Beans 1.3 1.6 1.6 0.6<br />
Games 0.8 1.2 1.9 1.5<br />
How Far? 0.4 0.3 1.0 0.8<br />
Link Task 30 6.0 5.6 6.4 2.9<br />
Link Task 31 1.2 1.8 2.0 1.4<br />
Link Task 32 1.4 0.9 1.7 1.3<br />
Link Task 33 2.8 2.9 3.7 1.6<br />
Link Task 34 0.6 1.4 1.7 1.4<br />
Link Task 35 0.5 0.4 0.6 0.5<br />
Link Task 36 1.1 1.3 1.2 1.4<br />
For year 8 students, there were statistically significant<br />
differences in performance among the three groups on<br />
35 of the 93 tasks:<br />
➢ on 11 tasks both Pacific and Māori students scored<br />
lower than “other” students;<br />
➢ on 13 tasks only Pacific students scored lower than<br />
“other” students;<br />
➢ on 6 tasks only Māori students scored lower than<br />
“other” students;<br />
➢ on 2 tasks Māori students scored lower than both<br />
Pacific and “other” students;<br />
➢ on 1 task Pacific and “other” students scored lower<br />
than Māori students;<br />
➢ on 1 task Pacific students scored lower than just Māori<br />
students;<br />
➢ on 1 task Pacific students scored lower than both<br />
Māori and “other” students.<br />
Thus Pacific students scored lower than “other” students<br />
on 27 percent of tasks (and never higher), and Māori<br />
students scored lower than “other” students on 20 percent<br />
of tasks (and higher on 1 percent of tasks). Pacific<br />
students scored lower than Māori students on 3 percent<br />
of tasks and higher on 2 percent of tasks.<br />
On the Year 8 Mathematics Survey (p62), there was a<br />
statistically significant difference on 1 of the 11 rating<br />
items. The Pacific students were more positive than both<br />
Māori and “other” students on Question 8 (How much do<br />
you like helping others with maths?).<br />
Summary<br />
In schools with more than 15 percent Pacific students,<br />
Year 4 Pacific students performed similarly to their Māori<br />
peers, but less well than “other” students on 45 percent<br />
of the tasks. Year 8 Pacific students performed similarly<br />
to their Māori peers, but less well than “other” students<br />
on 27 percent of the tasks.