mathematics
Mathematics 2001.pdf [33.7 MB] - NEMP - University of Otago
Mathematics 2001.pdf [33.7 MB] - NEMP - University of Otago
- No tags were found...

You also want an ePaper? Increase the reach of your titles
YUMPU automatically turns print PDFs into web optimized ePapers that Google loves.
chapter 4 27<br />
measurement<br />
The assessments included sixteen tasks investigating students’ understandings,<br />
processes and skills in the area of <strong>mathematics</strong> called measurement. Measurement<br />
includes knowledge, understanding and use of systems of measurement, the use of<br />
measurement apparatus, and processes of predicting, calculating and recording.<br />
This chapter includes tasks relating to money.<br />
Sixteen tasks were identical for both year 4 and year 8. Seven tasks had overlapping<br />
versions for year 4 and year 8 students, with some parts common to both levels.<br />
Three tasks were attempted by year 4 students only, and seven by year 8 only.<br />
Twelve are trend tasks (fully described with data for both 1997 and 2001), ten are<br />
released tasks (fully described with data for 2001 only), and eleven are link tasks<br />
(to be used again in 2005, so only partially described here).<br />
The tasks are presented in the three sections: trend tasks, then released tasks and<br />
finally link tasks. Within each section, tasks attempted (in whole or part) by both<br />
year 4 and year 8 students are presented first, followed by parallel tasks, then tasks<br />
attempted only by year 8 students.<br />
Averaged across 101 task components administered to both year 4 and year 8<br />
students, 25 percent more year 8 than year 4 students succeeded with these<br />
components. Year 8 students performed better on 95 of the 101 components. As<br />
expected, the differences were generally larger on more difficult tasks. These often<br />
were tasks that many year 4 students would not yet have had much opportunity<br />
to learn in school.<br />
There was little evidence of change between 1997 and 2001. Averaged across<br />
41 trend task components attempted by year 4 students in both years, 2 percent<br />
more students succeeded in 2001 than in 1997. Gains occurred on 25 of the 41<br />
components. At year 8 level, with 45 trend task components included, 2 percent<br />
fewer students succeeded in 2001 than in 1997. Gains occurred on 15 of the 45<br />
components.<br />
A representative range of measurement systems, processes and applications was<br />
covered in the set of tasks attempted by students. At both levels students’ skills<br />
of reading measurements were substantially stronger than those of making good<br />
estimations. Moderate to low<br />
percentages of year 8 and year 4<br />
students demonstrated abilities<br />
to effectively explain processes<br />
and strategies for making and<br />
checking measurements.<br />
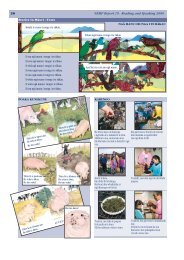
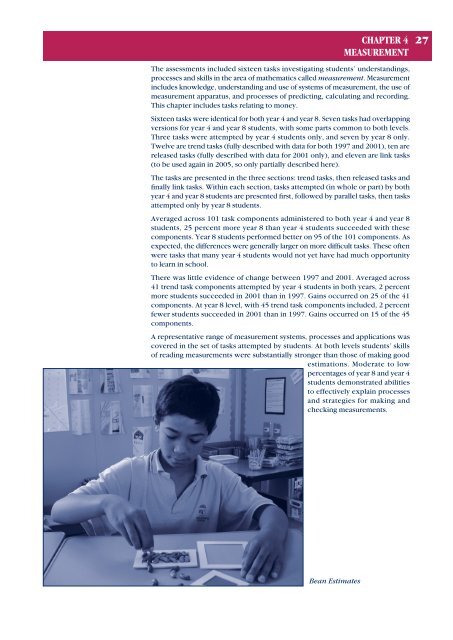
Bean Estimates