mathematics
Mathematics 2001.pdf [33.7 MB] - NEMP - University of Otago
Mathematics 2001.pdf [33.7 MB] - NEMP - University of Otago
- No tags were found...

You also want an ePaper? Increase the reach of your titles
YUMPU automatically turns print PDFs into web optimized ePapers that Google loves.
60 Chapter 7<br />
<strong>mathematics</strong> surveys<br />
Students’ attitudes, interests and liking for<br />
a subject have a strong bearing on their<br />
achievement. The Mathematics Survey<br />
sought information from students about their<br />
curriculum preferences and perceptions of<br />
their own achievement. The questions were<br />
the same for year 4 and year 8 students. The<br />
survey was administered to the students in an<br />
independent session (four students working<br />
individually on tasks, supported by a teacher).<br />
The questions were read to year 4 students,<br />
and also to individual year 8 students who<br />
requested this help. Writing help was available<br />
if requested.<br />
The survey included eleven items which<br />
asked students to record a rating response by<br />
circling their choice, two items which asked<br />
them to select three preferences from a list,<br />
one item which asked them to nominate<br />
up to six activities, and three items which<br />
invited them to write comments.<br />
The students were first asked to select their<br />
three favourite school subjects from a list of<br />
twelve subjects. The results are shown below, together<br />
with the corresponding 1997 results.<br />
Three Favourites:<br />
Percentages of students rating subjects<br />
among their 3 favourites<br />
% responses<br />
2001 (’97) 2001 (’97)<br />
year 4 year 8<br />
Subject: Art 64 (68) 52 (43)<br />
Physical Education 49 (47) 62 (57)<br />
Mathematics 42 (42) 26 (35)<br />
Reading 33 (30) 18 (16)<br />
Writing 31 (19) 13 (13)<br />
Music 27 (27) 22 (25)<br />
Science 20 (22) 25 (23)<br />
Technology 9 (10) 46 (30)<br />
Māori 8 (9) 6 (11)<br />
Social Studies 4 (5) 13 (16)<br />
Speaking 3 (4) 8 (9)<br />
Health 1 (3) 4 (3)<br />
Mathematics was the third most popular option for year<br />
4 students and the fourth most popular option for year 8<br />
students. At year 4 level its popularity remained constant<br />
between 1997 and 2001, but at year 8 level it was chosen<br />
by 9 percent fewer students while technology and art<br />
gained substantially over the four year period.<br />
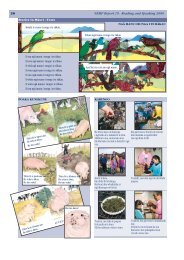
Students were presented with a list of nine <strong>mathematics</strong><br />
activities and asked to nominate up to three that they<br />
liked doing at school. The responses are shown below,<br />
in percentage order for year 4 students. Comparative figures<br />
are given for 1997, but it should be noted that four<br />
additional choices were available in 1997 so the percentages<br />
are not strictly comparable.<br />
The most notable changes from year 4 to year 8 are that<br />
“maths problems and puzzles” are substantially more<br />
popular at year 8 level, while “work in my maths book”<br />
is substantially less popular at year 8 level. Comparing<br />
the 1997 and 2001 results, “maths problems and puzzles”<br />
and “using equipment” became more popular at<br />
both levels.<br />
Maths activities students like<br />
doing at school:<br />
% responses<br />
2001 (’97) 2001 (’97)<br />
year 4 year 8<br />
Doing maths work sheets 41 (41) 33 (30)<br />
Work in my maths book 40 (34) 22 (21)<br />
Maths problems and puzzles 39 (30) 60 (43)<br />
Using equipment 35 (21) 43 (27)<br />
Maths tests 30 (23) 16 (16)<br />
Using a calculator 29 (31) 27 (26)<br />
Maths competitions 22 (18) 25 (17)<br />
Using maths textbooks 14 (11) 17 (14)<br />
Something else 5 (3) 10 (7)