Projections Dataset and Methodology
Population and Employment Projection Dataset and ... - FAMPO
Population and Employment Projection Dataset and ... - FAMPO
- No tags were found...

Create successful ePaper yourself
Turn your PDF publications into a flip-book with our unique Google optimized e-Paper software.
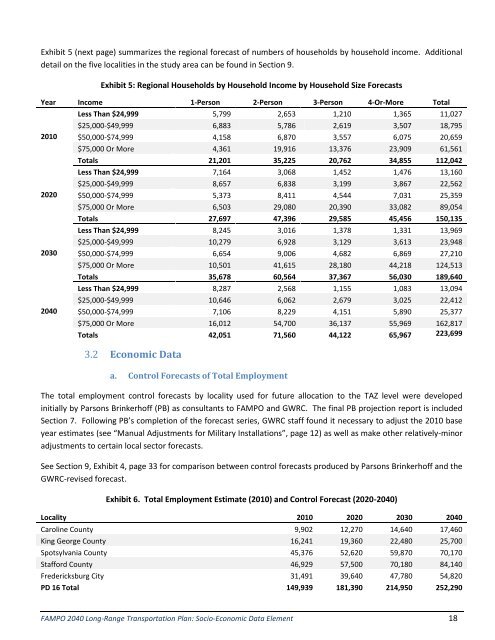
Exhibit 5 (next page) summarizes the regional forecast of numbers of households by household income. Additional<br />
detail on the five localities in the study area can be found in Section 9.<br />
Exhibit 5: Regional Households by Household Income by Household Size Forecasts<br />
Year Income 1-Person 2-Person 3-Person 4-Or-More Total<br />
Less Than $24,999 5,799 2,653 1,210 1,365 11,027<br />
$25,000-$49,999 6,883 5,786 2,619 3,507 18,795<br />
2010 $50,000-$74,999 4,158 6,870 3,557 6,075 20,659<br />
$75,000 Or More 4,361 19,916 13,376 23,909 61,561<br />
Totals 21,201 35,225 20,762 34,855 112,042<br />
Less Than $24,999 7,164 3,068 1,452 1,476 13,160<br />
$25,000-$49,999 8,657 6,838 3,199 3,867 22,562<br />
2020 $50,000-$74,999 5,373 8,411 4,544 7,031 25,359<br />
$75,000 Or More 6,503 29,080 20,390 33,082 89,054<br />
Totals 27,697 47,396 29,585 45,456 150,135<br />
Less Than $24,999 8,245 3,016 1,378 1,331 13,969<br />
$25,000-$49,999 10,279 6,928 3,129 3,613 23,948<br />
2030 $50,000-$74,999 6,654 9,006 4,682 6,869 27,210<br />
$75,000 Or More 10,501 41,615 28,180 44,218 124,513<br />
Totals 35,678 60,564 37,367 56,030 189,640<br />
Less Than $24,999 8,287 2,568 1,155 1,083 13,094<br />
$25,000-$49,999 10,646 6,062 2,679 3,025 22,412<br />
2040 $50,000-$74,999 7,106 8,229 4,151 5,890 25,377<br />
$75,000 Or More 16,012 54,700 36,137 55,969 162,817<br />
Totals 42,051 71,560 44,122 65,967 223,699<br />
3.2 Economic Data<br />
a. Control Forecasts of Total Employment<br />
The total employment control forecasts by locality used for future allocation to the TAZ level were developed<br />
initially by Parsons Brinkerhoff (PB) as consultants to FAMPO <strong>and</strong> GWRC. The final PB projection report is included<br />
Section 7. Following PB’s completion of the forecast series, GWRC staff found it necessary to adjust the 2010 base<br />
year estimates (see “Manual Adjustments for Military Installations”, page 12) as well as make other relatively-minor<br />
adjustments to certain local sector forecasts.<br />
See Section 9, Exhibit 4, page 33 for comparison between control forecasts produced by Parsons Brinkerhoff <strong>and</strong> the<br />
GWRC-revised forecast.<br />
Exhibit 6. Total Employment Estimate (2010) <strong>and</strong> Control Forecast (2020-2040)<br />
Locality 2010 2020 2030 2040<br />
Caroline County 9,902 12,270 14,640 17,460<br />
King George County 16,241 19,360 22,480 25,700<br />
Spotsylvania County 45,376 52,620 59,870 70,170<br />
Stafford County 46,929 57,500 70,180 84,140<br />
Fredericksburg City 31,491 39,640 47,780 54,820<br />
PD 16 Total 149,939 181,390 214,950 252,290<br />
FAMPO 2040 Long-Range Transportation Plan: Socio-Economic Data Element 18