Projections Dataset and Methodology
Population and Employment Projection Dataset and ... - FAMPO
Population and Employment Projection Dataset and ... - FAMPO
- No tags were found...

Create successful ePaper yourself
Turn your PDF publications into a flip-book with our unique Google optimized e-Paper software.
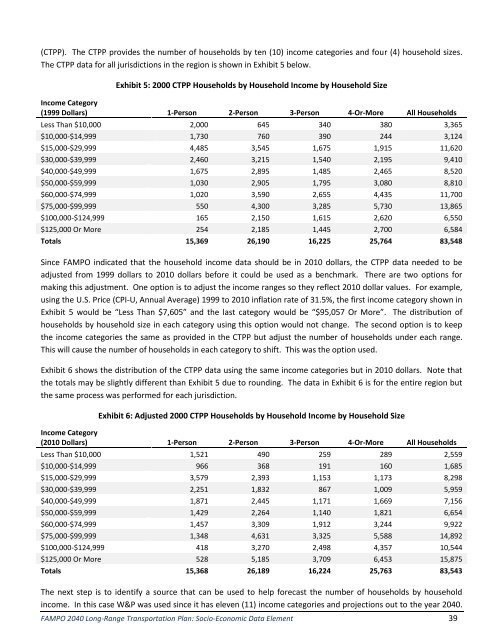
(CTPP). The CTPP provides the number of households by ten (10) income categories <strong>and</strong> four (4) household sizes.<br />
The CTPP data for all jurisdictions in the region is shown in Exhibit 5 below.<br />
Exhibit 5: 2000 CTPP Households by Household Income by Household Size<br />
Income Category<br />
(1999 Dollars) 1-Person 2-Person 3-Person 4-Or-More All Households<br />
Less Than $10,000 2,000 645 340 380 3,365<br />
$10,000-$14,999 1,730 760 390 244 3,124<br />
$15,000-$29,999 4,485 3,545 1,675 1,915 11,620<br />
$30,000-$39,999 2,460 3,215 1,540 2,195 9,410<br />
$40,000-$49,999 1,675 2,895 1,485 2,465 8,520<br />
$50,000-$59,999 1,030 2,905 1,795 3,080 8,810<br />
$60,000-$74,999 1,020 3,590 2,655 4,435 11,700<br />
$75,000-$99,999 550 4,300 3,285 5,730 13,865<br />
$100,000-$124,999 165 2,150 1,615 2,620 6,550<br />
$125,000 Or More 254 2,185 1,445 2,700 6,584<br />
Totals 15,369 26,190 16,225 25,764 83,548<br />
Since FAMPO indicated that the household income data should be in 2010 dollars, the CTPP data needed to be<br />
adjusted from 1999 dollars to 2010 dollars before it could be used as a benchmark. There are two options for<br />
making this adjustment. One option is to adjust the income ranges so they reflect 2010 dollar values. For example,<br />
using the U.S. Price (CPI-U, Annual Average) 1999 to 2010 inflation rate of 31.5%, the first income category shown in<br />
Exhibit 5 would be “Less Than $7,605” <strong>and</strong> the last category would be “$95,057 Or More”. The distribution of<br />
households by household size in each category using this option would not change. The second option is to keep<br />
the income categories the same as provided in the CTPP but adjust the number of households under each range.<br />
This will cause the number of households in each category to shift. This was the option used.<br />
Exhibit 6 shows the distribution of the CTPP data using the same income categories but in 2010 dollars. Note that<br />
the totals may be slightly different than Exhibit 5 due to rounding. The data in Exhibit 6 is for the entire region but<br />
the same process was performed for each jurisdiction.<br />
Exhibit 6: Adjusted 2000 CTPP Households by Household Income by Household Size<br />
Income Category<br />
(2010 Dollars) 1-Person 2-Person 3-Person 4-Or-More All Households<br />
Less Than $10,000 1,521 490 259 289 2,559<br />
$10,000-$14,999 966 368 191 160 1,685<br />
$15,000-$29,999 3,579 2,393 1,153 1,173 8,298<br />
$30,000-$39,999 2,251 1,832 867 1,009 5,959<br />
$40,000-$49,999 1,871 2,445 1,171 1,669 7,156<br />
$50,000-$59,999 1,429 2,264 1,140 1,821 6,654<br />
$60,000-$74,999 1,457 3,309 1,912 3,244 9,922<br />
$75,000-$99,999 1,348 4,631 3,325 5,588 14,892<br />
$100,000-$124,999 418 3,270 2,498 4,357 10,544<br />
$125,000 Or More 528 5,185 3,709 6,453 15,875<br />
Totals 15,368 26,189 16,224 25,763 83,543<br />
The next step is to identify a source that can be used to help forecast the number of households by household<br />
income. In this case W&P was used since it has eleven (11) income categories <strong>and</strong> projections out to the year 2040.<br />
FAMPO 2040 Long-Range Transportation Plan: Socio-Economic Data Element 39