Projections Dataset and Methodology
Population and Employment Projection Dataset and ... - FAMPO
Population and Employment Projection Dataset and ... - FAMPO
- No tags were found...

You also want an ePaper? Increase the reach of your titles
YUMPU automatically turns print PDFs into web optimized ePapers that Google loves.
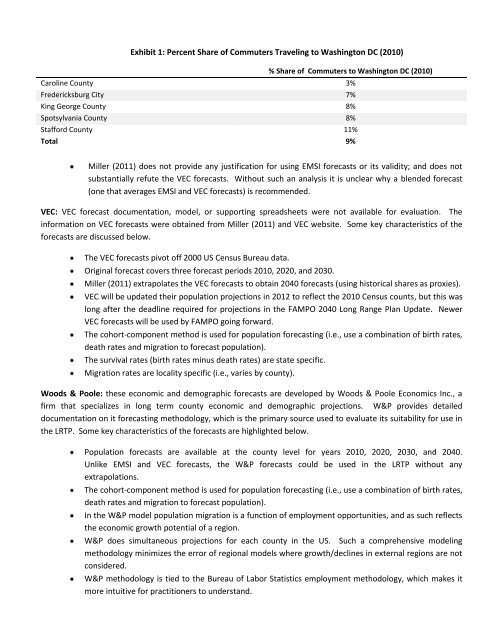
Exhibit 1: Percent Share of Commuters Traveling to Washington DC (2010)<br />
% Share of Commuters to Washington DC (2010)<br />
Caroline County 3%<br />
Fredericksburg City 7%<br />
King George County 8%<br />
Spotsylvania County 8%<br />
Stafford County 11%<br />
Total 9%<br />
Miller (2011) does not provide any justification for using EMSI forecasts or its validity; <strong>and</strong> does not<br />
substantially refute the VEC forecasts. Without such an analysis it is unclear why a blended forecast<br />
(one that averages EMSI <strong>and</strong> VEC forecasts) is recommended.<br />
VEC: VEC forecast documentation, model, or supporting spreadsheets were not available for evaluation. The<br />
information on VEC forecasts were obtained from Miller (2011) <strong>and</strong> VEC website. Some key characteristics of the<br />
forecasts are discussed below.<br />
The VEC forecasts pivot off 2000 US Census Bureau data.<br />
Original forecast covers three forecast periods 2010, 2020, <strong>and</strong> 2030.<br />
Miller (2011) extrapolates the VEC forecasts to obtain 2040 forecasts (using historical shares as proxies).<br />
VEC will be updated their population projections in 2012 to reflect the 2010 Census counts, but this was<br />
long after the deadline required for projections in the FAMPO 2040 Long Range Plan Update. Newer<br />
VEC forecasts will be used by FAMPO going forward.<br />
The cohort-component method is used for population forecasting (i.e., use a combination of birth rates,<br />
death rates <strong>and</strong> migration to forecast population).<br />
The survival rates (birth rates minus death rates) are state specific.<br />
Migration rates are locality specific (i.e., varies by county).<br />
Woods & Poole: these economic <strong>and</strong> demographic forecasts are developed by Woods & Poole Economics Inc., a<br />
firm that specializes in long term county economic <strong>and</strong> demographic projections. W&P provides detailed<br />
documentation on it forecasting methodology, which is the primary source used to evaluate its suitability for use in<br />
the LRTP. Some key characteristics of the forecasts are highlighted below.<br />
Population forecasts are available at the county level for years 2010, 2020, 2030, <strong>and</strong> 2040.<br />
Unlike EMSI <strong>and</strong> VEC forecasts, the W&P forecasts could be used in the LRTP without any<br />
extrapolations.<br />
The cohort-component method is used for population forecasting (i.e., use a combination of birth rates,<br />
death rates <strong>and</strong> migration to forecast population).<br />
In the W&P model population migration is a function of employment opportunities, <strong>and</strong> as such reflects<br />
the economic growth potential of a region.<br />
W&P does simultaneous projections for each county in the US. Such a comprehensive modeling<br />
methodology minimizes the error of regional models where growth/declines in external regions are not<br />
considered.<br />
W&P methodology is tied to the Bureau of Labor Statistics employment methodology, which makes it<br />
more intuitive for practitioners to underst<strong>and</strong>.