Projections Dataset and Methodology
Population and Employment Projection Dataset and ... - FAMPO
Population and Employment Projection Dataset and ... - FAMPO
- No tags were found...

Create successful ePaper yourself
Turn your PDF publications into a flip-book with our unique Google optimized e-Paper software.
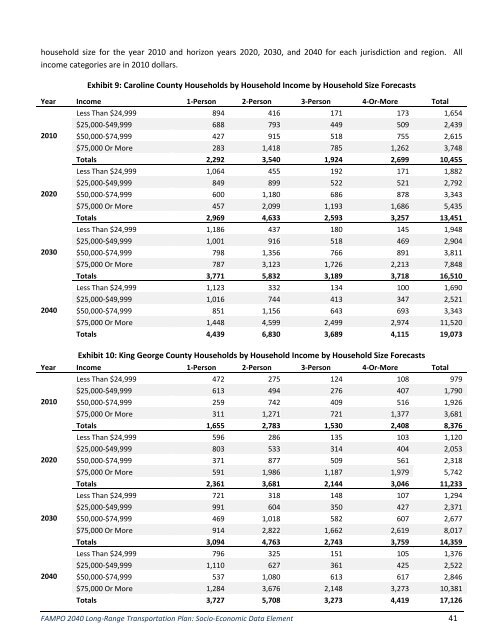
household size for the year 2010 <strong>and</strong> horizon years 2020, 2030, <strong>and</strong> 2040 for each jurisdiction <strong>and</strong> region. All<br />
income categories are in 2010 dollars.<br />
Exhibit 9: Caroline County Households by Household Income by Household Size Forecasts<br />
Year Income 1-Person 2-Person 3-Person 4-Or-More Total<br />
Less Than $24,999 894 416 171 173 1,654<br />
$25,000-$49,999 688 793 449 509 2,439<br />
2010 $50,000-$74,999 427 915 518 755 2,615<br />
$75,000 Or More 283 1,418 785 1,262 3,748<br />
Totals 2,292 3,540 1,924 2,699 10,455<br />
Less Than $24,999 1,064 455 192 171 1,882<br />
$25,000-$49,999 849 899 522 521 2,792<br />
2020 $50,000-$74,999 600 1,180 686 878 3,343<br />
$75,000 Or More 457 2,099 1,193 1,686 5,435<br />
Totals 2,969 4,633 2,593 3,257 13,451<br />
Less Than $24,999 1,186 437 180 145 1,948<br />
$25,000-$49,999 1,001 916 518 469 2,904<br />
2030 $50,000-$74,999 798 1,356 766 891 3,811<br />
$75,000 Or More 787 3,123 1,726 2,213 7,848<br />
Totals 3,771 5,832 3,189 3,718 16,510<br />
Less Than $24,999 1,123 332 134 100 1,690<br />
$25,000-$49,999 1,016 744 413 347 2,521<br />
2040 $50,000-$74,999 851 1,156 643 693 3,343<br />
$75,000 Or More 1,448 4,599 2,499 2,974 11,520<br />
Totals 4,439 6,830 3,689 4,115 19,073<br />
Exhibit 10: King George County Households by Household Income by Household Size Forecasts<br />
Year Income 1-Person 2-Person 3-Person 4-Or-More Total<br />
Less Than $24,999 472 275 124 108 979<br />
$25,000-$49,999 613 494 276 407 1,790<br />
2010 $50,000-$74,999 259 742 409 516 1,926<br />
$75,000 Or More 311 1,271 721 1,377 3,681<br />
Totals 1,655 2,783 1,530 2,408 8,376<br />
Less Than $24,999 596 286 135 103 1,120<br />
$25,000-$49,999 803 533 314 404 2,053<br />
2020 $50,000-$74,999 371 877 509 561 2,318<br />
$75,000 Or More 591 1,986 1,187 1,979 5,742<br />
Totals 2,361 3,681 2,144 3,046 11,233<br />
Less Than $24,999 721 318 148 107 1,294<br />
$25,000-$49,999 991 604 350 427 2,371<br />
2030 $50,000-$74,999 469 1,018 582 607 2,677<br />
$75,000 Or More 914 2,822 1,662 2,619 8,017<br />
Totals 3,094 4,763 2,743 3,759 14,359<br />
Less Than $24,999 796 325 151 105 1,376<br />
$25,000-$49,999 1,110 627 361 425 2,522<br />
2040 $50,000-$74,999 537 1,080 613 617 2,846<br />
$75,000 Or More 1,284 3,676 2,148 3,273 10,381<br />
Totals 3,727 5,708 3,273 4,419 17,126<br />
FAMPO 2040 Long-Range Transportation Plan: Socio-Economic Data Element 41