TECHNOLOGY-BASED LAB ACTIVITIES
Lab Activities (PE).pdf - langlopress.net
Lab Activities (PE).pdf - langlopress.net

You also want an ePaper? Increase the reach of your titles
YUMPU automatically turns print PDFs into web optimized ePapers that Google loves.
12. To test your prediction, choose a starting position and hold the cardboard at<br />
that point. Start data collection by pressing e. When you hear the<br />
motion detector begin to click, move the cardboard in such a way that the<br />
graph of the cardboard’s motion matches the target graph on the calculator<br />
screen. Be careful not to trip or bump into anyone or anything as you move.<br />
13. If you were not successful, repeat step 12 until the graph of the cardboard’s<br />
motion closely matches the graph on the screen. To repeat with the same<br />
graph, press e and select SAME MATCH from the OPTIONS menu. Sketch<br />
the graph with your best attempt.<br />
14. Perform a second distance graph match (steps 10–12) by pressing e and<br />
selecting NEW MATCH from the OPTIONS menu.<br />
15. Perform steps 4–8 of the Analysis (on page 5) before proceeding to Part III<br />
of the Procedure.<br />
Part IIl Velocity-Time Graph Matching<br />
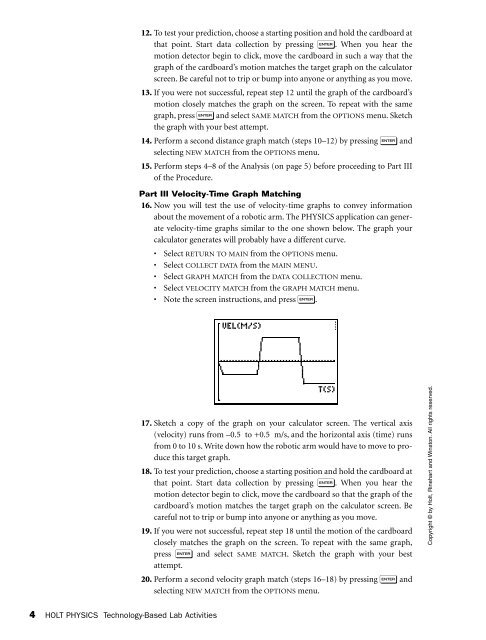
16. Now you will test the use of velocity-time graphs to convey information<br />
about the movement of a robotic arm. The PHYSICS application can generate<br />
velocity-time graphs similar to the one shown below. The graph your<br />
calculator generates will probably have a different curve.<br />
• Select RETURN TO MAIN from the OPTIONS menu.<br />
• Select COLLECT DATA from the MAIN MENU.<br />
• Select GRAPH MATCH from the DATA COLLECTION menu.<br />
• Select VELOCITY MATCH from the GRAPH MATCH menu.<br />
• Note the screen instructions, and press e.<br />
17. Sketch a copy of the graph on your calculator screen. The vertical axis<br />
(velocity) runs from –0.5 to +0.5 m/s, and the horizontal axis (time) runs<br />
from 0 to 10 s. Write down how the robotic arm would have to move to produce<br />
this target graph.<br />
18. To test your prediction, choose a starting position and hold the cardboard at<br />
that point. Start data collection by pressing e. When you hear the<br />
motion detector begin to click, move the cardboard so that the graph of the<br />
cardboard’s motion matches the target graph on the calculator screen. Be<br />
careful not to trip or bump into anyone or anything as you move.<br />
19. If you were not successful, repeat step 18 until the motion of the cardboard<br />
closely matches the graph on the screen. To repeat with the same graph,<br />
press e and select SAME MATCH. Sketch the graph with your best<br />
attempt.<br />
20. Perform a second velocity graph match (steps 16–18) by pressing e and<br />
selecting NEW MATCH from the OPTIONS menu.<br />
Copyright © by Holt, Rinehart and Winston. All rights reserved.<br />
4 HOLT PHYSICS Technology-Based Lab Activities