TECHNOLOGY-BASED LAB ACTIVITIES
Lab Activities (PE).pdf - langlopress.net
Lab Activities (PE).pdf - langlopress.net

Create successful ePaper yourself
Turn your PDF publications into a flip-book with our unique Google optimized e-Paper software.
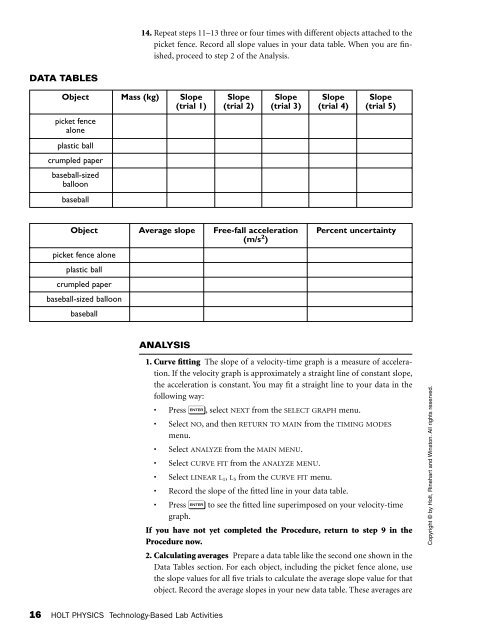
14. Repeat steps 11–13 three or four times with different objects attached to the<br />
picket fence. Record all slope values in your data table. When you are finished,<br />
proceed to step 2 of the Analysis.<br />
DATA TABLES<br />
Object Mass (kg) Slope Slope Slope Slope Slope<br />
(trial 1) (trial 2) (trial 3) (trial 4) (trial 5)<br />
picket fence<br />
alone<br />
plastic ball<br />
crumpled paper<br />
baseball-sized<br />
balloon<br />
baseball<br />
Object Average slope Free-fall acceleration Percent uncertainty<br />
(m/s 2 )<br />
picket fence alone<br />
plastic ball<br />
crumpled paper<br />
baseball-sized balloon<br />
baseball<br />
ANALYSIS<br />
1. Curve fitting The slope of a velocity-time graph is a measure of acceleration.<br />
If the velocity graph is approximately a straight line of constant slope,<br />
the acceleration is constant. You may fit a straight line to your data in the<br />
following way:<br />
• Press e, select NEXT from the SELECT GRAPH menu.<br />
• Select NO, and then RETURN TO MAIN from the TIMING MODES<br />
menu.<br />
• Select ANALYZE from the MAIN MENU.<br />
• Select CURVE FIT from the ANALYZE MENU.<br />
• Select LINEAR L 1 , L 5 from the CURVE FIT menu.<br />
• Record the slope of the fitted line in your data table.<br />
• Press e to see the fitted line superimposed on your velocity-time<br />
graph.<br />
If you have not yet completed the Procedure, return to step 9 in the<br />
Procedure now.<br />
2. Calculating averages Prepare a data table like the second one shown in the<br />
Data Tables section. For each object, including the picket fence alone, use<br />
the slope values for all five trials to calculate the average slope value for that<br />
object. Record the average slopes in your new data table. These averages are<br />
Copyright © by Holt, Rinehart and Winston. All rights reserved.<br />
16 HOLT PHYSICS Technology-Based Lab Activities