TECHNOLOGY-BASED LAB ACTIVITIES
Lab Activities (PE).pdf - langlopress.net
Lab Activities (PE).pdf - langlopress.net

Create successful ePaper yourself
Turn your PDF publications into a flip-book with our unique Google optimized e-Paper software.
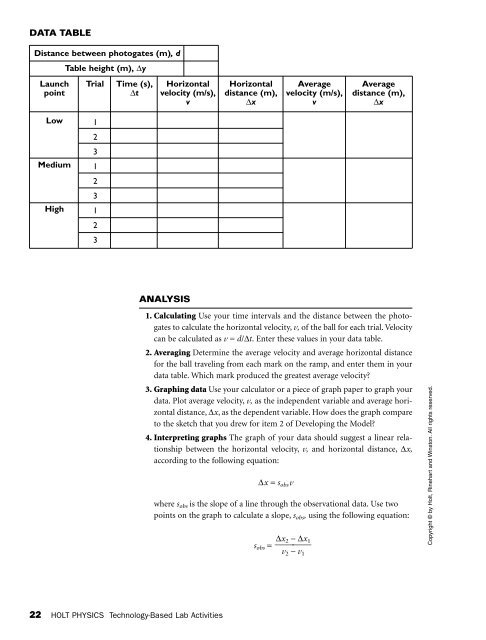
DATA TABLE<br />
Distance between photogates (m), d<br />
Table height (m), ∆y<br />
Launch<br />
point<br />
Trial<br />
Time (s),<br />
∆t<br />
Horizontal<br />
velocity (m/s),<br />
v<br />
Horizontal<br />
distance (m),<br />
∆x<br />
Average<br />
velocity (m/s),<br />
v<br />
Average<br />
distance (m),<br />
∆x<br />
Low<br />
Medium<br />
High<br />
1<br />
2<br />
3<br />
1<br />
2<br />
3<br />
1<br />
2<br />
3<br />
ANALYSIS<br />
1. Calculating Use your time intervals and the distance between the photogates<br />
to calculate the horizontal velocity, v, of the ball for each trial. Velocity<br />
can be calculated as v = d/∆t. Enter these values in your data table.<br />
2. Averaging Determine the average velocity and average horizontal distance<br />
for the ball traveling from each mark on the ramp, and enter them in your<br />
data table. Which mark produced the greatest average velocity?<br />
3. Graphing data Use your calculator or a piece of graph paper to graph your<br />
data. Plot average velocity, v, as the independent variable and average horizontal<br />
distance, ∆x, as the dependent variable. How does the graph compare<br />
to the sketch that you drew for item 2 of Developing the Model?<br />
4. Interpreting graphs The graph of your data should suggest a linear relationship<br />
between the horizontal velocity, v, and horizontal distance, ∆x,<br />
according to the following equation:<br />
∆x = s obs v<br />
where s obs is the slope of a line through the observational data. Use two<br />
points on the graph to calculate a slope, s obs , using the following equation:<br />
s obs = ∆x 2 −∆x 1<br />
⎯⎯<br />
v2 − v 1<br />
Copyright © by Holt, Rinehart and Winston. All rights reserved.<br />
22 HOLT PHYSICS Technology-Based Lab Activities