Deepwater Gulf of Mexico 2004: America's Expanding ... - OCS BBS
Deepwater Gulf of Mexico 2004: America's Expanding ... - OCS BBS
Deepwater Gulf of Mexico 2004: America's Expanding ... - OCS BBS
- No tags were found...

Create successful ePaper yourself
Turn your PDF publications into a flip-book with our unique Google optimized e-Paper software.
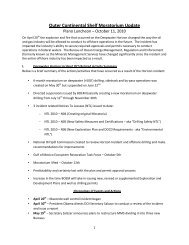
S hallo w-<br />
wa ter GOM<br />
11%<br />
<strong>Deepwater</strong><br />
GOM<br />
17 %<br />
Shallowwater<br />
GOM<br />
16 %<br />
<strong>Deepwater</strong><br />
GOM<br />
7%<br />
Other U.S.<br />
72%<br />
Other U.S.<br />
77%<br />
Figure 60. Estimated U.S. oil and gas production in 2002.<br />
Figure 61a illustrates historic trends in oil production. Shallow-water oil production rose rapidly in<br />
the 1960’s, peaked in 1971, and has undergone cycles <strong>of</strong> increase and decline since then. Since<br />
1997, the shallow-water GOM oil production has steadily declined and, at the end <strong>of</strong> 2002, was at its<br />
lowest level since 1967. The deepwater GOM oil production, however, is in the midst <strong>of</strong> a dramatic<br />
increase similar to that seen in the shallow-water GOM during the 1960’s. Melancon et al. (2003)<br />
predict that this production surge has not yet peaked. This strong increase in deepwater oil<br />
production more than <strong>of</strong>fsets recent declines in shallow-water oil production. In 2002, deepwater oil<br />
production accounted for approximately 61 percent <strong>of</strong> GOM oil production.<br />
Figure 61b shows similar production trends for gas. Shallow-water gas production rose sharply<br />
throughout the 1960’s and 1970’s, and then remained relatively stable over the next 15 years before<br />
declining steadily from 1996 through today. Although the deepwater gas production increase has not<br />
been as dramatic as with oil, the steady increase in deepwater gas production that occurred in the past<br />
few years <strong>of</strong>fsets the shallow-water decline. Appendix H lists historical GOM oil and gas production<br />
rates. These trends in oil and gas production indicate that the deepwater GOM frontier continues to<br />
expand.<br />
As discussed previously, the <strong>Deepwater</strong> Royalty Relief Act (DWRRA) had a significant effect on<br />
deepwater leasing and drilling. Numerous projects with royalty relief eligibility have come online in<br />
recent years (table 4), but the impact <strong>of</strong> the DWRRA on deepwater production is just now beginning<br />
to show. Figure 62a shows the contribution <strong>of</strong> <strong>Deepwater</strong> Royalty Relief (DWRR) oil production to<br />
total “deepwater” GOM oil production, where “deepwater” is defined as 200 m (656 ft), the<br />
minimum water depth for which DWRR incentives are <strong>of</strong>fered, instead <strong>of</strong> 1,000 ft (305 m), the<br />
definition used elsewhere in this report. The amount <strong>of</strong> oil production subject to royalty suspension<br />
has hovered around 5 percent <strong>of</strong> the total “deepwater” production since mid-2001. Figure 62b<br />
displays total “deepwater” gas production along with pre-DWRRA and post-DWRRA gas production<br />
subject to royalty relief. The volume <strong>of</strong> natural gas subject to DWRR increased rapidly in 2002,<br />
reaching 14 percent <strong>of</strong> total “deepwater” production by the end <strong>of</strong> that year. Note that pre-DWRRA<br />
production refers to production from leases that have been approved to receive DWRR but were<br />
issued before November 28, 1995. Post-DWRRA production refers to DWRR production from<br />
leases that were issued after that date.<br />
Approximately 300,000 barrels <strong>of</strong> oil and 2 billion cubic feet <strong>of</strong> gas come from deepwater subsea<br />
completions each day. Subsea completions currently account for about 30 percent <strong>of</strong> deepwater oil<br />
87