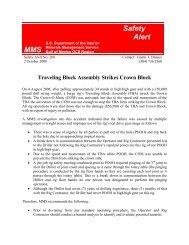
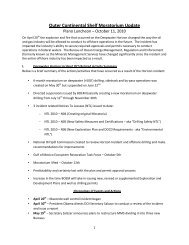
900,000 800,000 Majors Nonmajors 700,000 600,000 Barrels <strong>of</strong> Oil per Day 500,000 400,000 300,000 200,000 100,000 0 Jan-92 Jan-93 Jan-94 Jan-95 Jan-96 Jan-97 Jan-98 Jan-99 Jan-00 Jan-01 Jan-02 Month Figure 64a. Comparison <strong>of</strong> major and nonmajor companies in terms <strong>of</strong> deepwater oil production. 9,000,000 8,000,000 Majors Nonmajors 7,000,000 Thousand Cubic Feet per Day 6,000,000 5,000,000 4,000,000 3,000,000 2,000,000 1,000,000 0 Jan-92 Jan-93 Jan-94 Jan-95 Jan-96 Jan-97 Jan-98 Jan-99 Jan-00 Jan-01 Jan-02 Figure 64b. Comparison <strong>of</strong> major and nonmajor companies in terms <strong>of</strong> deepwater gas production. Month 92
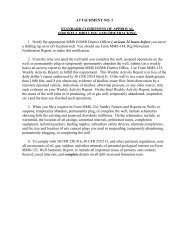
900,000 800,000 Majors Nonmajors 700,000 600,000 Barrels <strong>of</strong> Oil per Day 500,000 400,000 300,000 200,000 100,000 0 Jan-92 Jan-93 Jan-94 Jan-95 Jan-96 Jan-97 Jan-98 Jan-99 Jan-00 Jan-01 Jan-02 Figure 65a. Comparison <strong>of</strong> major and nonmajor companies in terms <strong>of</strong> shallow-water oil production. Month 9,000,000 8,000,000 Majors Nonmajors 7,000,000 Thousand Cubic feet per Day 6,000,000 5,000,000 4,000,000 3,000,000 2,000,000 1,000,000 0 Jan-92 Jan-93 Jan-94 Jan-95 Jan-96 Jan-97 Jan-98 Jan-99 Jan-00 Jan-01 Jan-02 Figure 65b. Comparison <strong>of</strong> major and nonmajor companies in terms <strong>of</strong> shallow-water gas production. Month 93
- Page 2 and 3:
ON COVER - The cover features four
- Page 5 and 6:
Table of Contents Page PREFACE.....
- Page 7 and 8:
Figures Page Figure 1. The Gulf of
- Page 9 and 10:
Figures — continued Page Figure 5
- Page 11:
Tables Page Table 1 List of Deepwat
- Page 15 and 16:
INTRODUCTION The deepwater Gulf of
- Page 17 and 18:
BACKGROUND DEFINITIONS The GOM Oute
- Page 19 and 20:
EXPANDING FRONTIER When the origina
- Page 21 and 22:
1992 - 1993 Louisiana Mississippi A
- Page 23 and 24:
1992 - 2003 Texas Louisiana Mississ
- Page 25 and 26:
fffffffffffffffff 1500 ft Quaternar
- Page 27 and 28:
In addition to the traditional oil
- Page 29 and 30:
15 Figure 8. Gas hydrates on the se
- Page 31 and 32:
1998 - 1999 Louisiana Mississippi A
- Page 33 and 34:
4,500 4,000 Number of Active Leases
- Page 35 and 36:
ENVIRONMENTAL ACTIVITY The extensiv
- Page 37 and 38:
Operators submit a remotely operate
- Page 39 and 40:
25 Figure 15. Loop and eddy current
- Page 41 and 42:
1975 - 1979 Louisiana Mississippi A
- Page 43 and 44:
29 Deepwater Discoveries $ #Y Texas
- Page 45 and 46:
31 Texas ð PORT ARANSAS 1000 ft 15
- Page 47 and 48:
Louisiana Mississippi Alabama 33 Te
- Page 49 and 50:
Pipelines New pipelines Proposed pi
- Page 51 and 52:
LEASING Until the mid-1990's, leasi
- Page 53 and 54:
Number of Leases Bid On 600 500 400
- Page 55 and 56: 1998 - 1999 Louisiana Mississippi A
- Page 57 and 58: 1992 - 1993 Louisiana Mississippi A
- Page 59 and 60: 2004 - 2005 (741 leases) Louisiana
- Page 61 and 62: DRILLING AND DEVELOPMENT Deepwater
- Page 63 and 64: 49 Figure 30. The Discoverer Deep S
- Page 65 and 66: 51 Number of Wells Spudded 250 200
- Page 67 and 68: 120 > 7,500 ft 107 108 100 5,000 -
- Page 69 and 70: 1998 - 1999 Louisiana Mississippi A
- Page 71 and 72: 1998 - 1999 Louisiana Mississippi A
- Page 73 and 74: 180 160 Deepwater EP Deepwater DOCD
- Page 75 and 76: 340 626 390 472 472 456 393 475 590
- Page 77 and 78: Year of First Production Table 4 De
- Page 79 and 80: Year of First Production Table 4 De
- Page 81 and 82: A predominant workhorse of the GOM
- Page 83 and 84: 3 Number Installed 2 1 0 2004 69 TL
- Page 85 and 86: Flow lines to host platform Subsea
- Page 87 and 88: 140 131 120 100 78 Number of Wells
- Page 89 and 90: RESERVES AND PRODUCTION The deepwat
- Page 91 and 92: 77 Million Barrels of Oil Equivalen
- Page 93 and 94: 18 16 14 12 10 8 Number of Fields 6
- Page 95 and 96: 81 Million Barrels of Oil Equivalen
- Page 97 and 98: 45,000 40,000 Million Barrels Oil E
- Page 99 and 100: 1992-1993 1994-1995 1996-1997 Lease
- Page 101 and 102: S hallo w- wa ter GOM 11% Deepwater
- Page 103 and 104: 1,200,000 1,000,000 Total productio
- Page 105: 1,100,000 1,000,000 Subsea oil Tota
- Page 109 and 110: 45,000 40,000 Max oil rate 1,000-1,
- Page 111 and 112: 4,000 3,500 Shallow water Deepwater
- Page 113 and 114: Texas Auger Louisiana SS182 Troika
- Page 115 and 116: SUMMARY AND CONCLUSIONS This report
- Page 117 and 118: 2,500 Number of leases Average U.S.
- Page 119 and 120: Number of Years 14 12 leas es in p
- Page 121 and 122: data for this analysis include only
- Page 123 and 124: 80 2500 70 60 Number of leases dril
- Page 125 and 126: 4,500 4,000 3,500 Leases tested Lea
- Page 127: • Nonmajor companies have made mo
- Page 131: REFERENCES Bascle, B. J., L. D. Nix
- Page 134 and 135: Project Name Area/Block Water Depth
- Page 136 and 137: Project Name Area/Block Water Depth
- Page 138 and 139: Project Name Area/Block Water Depth
- Page 140 and 141: Project Name Area/Block Water Depth
- Page 142 and 143: Project Name Area/Block Water Depth
- Page 144 and 145: Project Name Area/Block Water Depth
- Page 146 and 147: Sale Number Sale Location Sale Date
- Page 148 and 149: Completed Studies [MMS Study Number
- Page 150 and 151: Group Name Company Name MMS Number
- Page 152 and 153: Group Name Company Name MMS Number
- Page 154 and 155: Appendix G. Subsea Completions. Are
- Page 156 and 157:
Area Block API Number Operator Comp
- Page 158 and 159:
Area Block API Number Operator 144
- Page 160 and 161:
Area Block API Number Operator Comp
- Page 162 and 163:
Area Block API Number Operator Comp
- Page 164 and 165:
Year Shallowwater Oil (MBOPD) Deepw