76 Million Barrels <strong>of</strong> Oil Equivalent 3,000 2,500 2,000 1,500 1,000 500 >7,500 ft. 5,000-7,499 ft. 1,500-4,999 ft. 1,000-1,499 ft. 0-999 ft. 0 1965 1966 1967 1968 1969 1970 1971 1972 1973 1974 1975 1976 1977 1978 1979 1980 1981 1982 1983 1984 1985 1986 1987 1988 1989 1990 1991 1992 1993 1994 1995 1996 1997 1998 1999 2000 2001 2002 2003 >7,500 ft. 5,000-7,499 ft. 119 60.1 1,500-4,999 ft. 60.8 32.5 430 58.6 493 170 1061 475 138 5.79 49.7 307 152 119 154 238 217 8.8 1,000-1,499 ft. 310 112 83.3 192 222 155 19.5 8.56 31.9 0-999 ft. 607 1152 1213 557 527 412 2730 876 2201 2234 1040 936 481 465 581 820 252 556 537 801 525 166 294 437 113 168 111 29.8 111 87.3 119 82.8 126 84.7 31 42.3 >7,500 ft. 5,000-7,499 ft. 1,500-4,999 ft. 1,000-1,499 ft. 0-999 ft. Figure 51. Proved reserve additions.
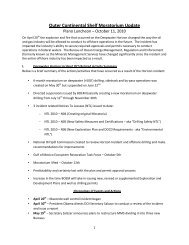
77 Million Barrels <strong>of</strong> Oil Equivalent 3,000 2,500 2,000 1,500 1,000 500 >7,500 ft. 5,000-7,499 ft. 1,500-4,999 ft. 1,000-1,499 ft. 0-999 ft. 0 1965 1966 1967 1968 1969 1970 1971 1972 1973 1974 1975 1976 1977 1978 1979 1980 1981 1982 1983 1984 1985 1986 1987 1988 1989 1990 1991 1992 1993 1994 1995 1996 1997 1998 1999 2000 2001 2002 2003 >7,500 ft. 46.26 0.875 5,000-7,499 ft. 119 53 44 154 184 12 780 986 613 13 1,500-4,999 ft. 64.45 34.24 461.2 152.5 492.6 184.9 1090 569.1 156.7 5.788 57.83 522.1 205.6 166.4 168.9 720.6 428.1 161.7 1,000-1,499 ft. 310.5 126.7 84.84 192.4 259 224.8 24.75 8.564 31.85 0-999 ft. 614.3 1169 1234 576.1 546.4 414.1 2754 879.2 2240 2281 1082 994.5 484.2 516.2 602.9 843.4 256.2 566.3 542.4 841.1 546.5 187.4 308.5 548.7 114 169.8 114.7 30.87 116.8 87.95 120.1 102.8 126 97.52 36.3 48.31 >7,500 ft. 5,000-7,499 ft. 1,500-4,999 ft. 1,000-1,499 ft. 0-999 ft. Figure 52. Proved and unproved reserve additions.
- Page 2 and 3:
ON COVER - The cover features four
- Page 5 and 6:
Table of Contents Page PREFACE.....
- Page 7 and 8:
Figures Page Figure 1. The Gulf of
- Page 9 and 10:
Figures — continued Page Figure 5
- Page 11:
Tables Page Table 1 List of Deepwat
- Page 15 and 16:
INTRODUCTION The deepwater Gulf of
- Page 17 and 18:
BACKGROUND DEFINITIONS The GOM Oute
- Page 19 and 20:
EXPANDING FRONTIER When the origina
- Page 21 and 22:
1992 - 1993 Louisiana Mississippi A
- Page 23 and 24:
1992 - 2003 Texas Louisiana Mississ
- Page 25 and 26:
fffffffffffffffff 1500 ft Quaternar
- Page 27 and 28:
In addition to the traditional oil
- Page 29 and 30:
15 Figure 8. Gas hydrates on the se
- Page 31 and 32:
1998 - 1999 Louisiana Mississippi A
- Page 33 and 34:
4,500 4,000 Number of Active Leases
- Page 35 and 36:
ENVIRONMENTAL ACTIVITY The extensiv
- Page 37 and 38:
Operators submit a remotely operate
- Page 39 and 40: 25 Figure 15. Loop and eddy current
- Page 41 and 42: 1975 - 1979 Louisiana Mississippi A
- Page 43 and 44: 29 Deepwater Discoveries $ #Y Texas
- Page 45 and 46: 31 Texas ð PORT ARANSAS 1000 ft 15
- Page 47 and 48: Louisiana Mississippi Alabama 33 Te
- Page 49 and 50: Pipelines New pipelines Proposed pi
- Page 51 and 52: LEASING Until the mid-1990's, leasi
- Page 53 and 54: Number of Leases Bid On 600 500 400
- Page 55 and 56: 1998 - 1999 Louisiana Mississippi A
- Page 57 and 58: 1992 - 1993 Louisiana Mississippi A
- Page 59 and 60: 2004 - 2005 (741 leases) Louisiana
- Page 61 and 62: DRILLING AND DEVELOPMENT Deepwater
- Page 63 and 64: 49 Figure 30. The Discoverer Deep S
- Page 65 and 66: 51 Number of Wells Spudded 250 200
- Page 67 and 68: 120 > 7,500 ft 107 108 100 5,000 -
- Page 69 and 70: 1998 - 1999 Louisiana Mississippi A
- Page 71 and 72: 1998 - 1999 Louisiana Mississippi A
- Page 73 and 74: 180 160 Deepwater EP Deepwater DOCD
- Page 75 and 76: 340 626 390 472 472 456 393 475 590
- Page 77 and 78: Year of First Production Table 4 De
- Page 79 and 80: Year of First Production Table 4 De
- Page 81 and 82: A predominant workhorse of the GOM
- Page 83 and 84: 3 Number Installed 2 1 0 2004 69 TL
- Page 85 and 86: Flow lines to host platform Subsea
- Page 87 and 88: 140 131 120 100 78 Number of Wells
- Page 89: RESERVES AND PRODUCTION The deepwat
- Page 93 and 94: 18 16 14 12 10 8 Number of Fields 6
- Page 95 and 96: 81 Million Barrels of Oil Equivalen
- Page 97 and 98: 45,000 40,000 Million Barrels Oil E
- Page 99 and 100: 1992-1993 1994-1995 1996-1997 Lease
- Page 101 and 102: S hallo w- wa ter GOM 11% Deepwater
- Page 103 and 104: 1,200,000 1,000,000 Total productio
- Page 105 and 106: 1,100,000 1,000,000 Subsea oil Tota
- Page 107 and 108: 900,000 800,000 Majors Nonmajors 70
- Page 109 and 110: 45,000 40,000 Max oil rate 1,000-1,
- Page 111 and 112: 4,000 3,500 Shallow water Deepwater
- Page 113 and 114: Texas Auger Louisiana SS182 Troika
- Page 115 and 116: SUMMARY AND CONCLUSIONS This report
- Page 117 and 118: 2,500 Number of leases Average U.S.
- Page 119 and 120: Number of Years 14 12 leas es in p
- Page 121 and 122: data for this analysis include only
- Page 123 and 124: 80 2500 70 60 Number of leases dril
- Page 125 and 126: 4,500 4,000 3,500 Leases tested Lea
- Page 127: • Nonmajor companies have made mo
- Page 131: REFERENCES Bascle, B. J., L. D. Nix
- Page 134 and 135: Project Name Area/Block Water Depth
- Page 136 and 137: Project Name Area/Block Water Depth
- Page 138 and 139: Project Name Area/Block Water Depth
- Page 140 and 141:
Project Name Area/Block Water Depth
- Page 142 and 143:
Project Name Area/Block Water Depth
- Page 144 and 145:
Project Name Area/Block Water Depth
- Page 146 and 147:
Sale Number Sale Location Sale Date
- Page 148 and 149:
Completed Studies [MMS Study Number
- Page 150 and 151:
Group Name Company Name MMS Number
- Page 152 and 153:
Group Name Company Name MMS Number
- Page 154 and 155:
Appendix G. Subsea Completions. Are
- Page 156 and 157:
Area Block API Number Operator Comp
- Page 158 and 159:
Area Block API Number Operator 144
- Page 160 and 161:
Area Block API Number Operator Comp
- Page 162 and 163:
Area Block API Number Operator Comp
- Page 164 and 165:
Year Shallowwater Oil (MBOPD) Deepw