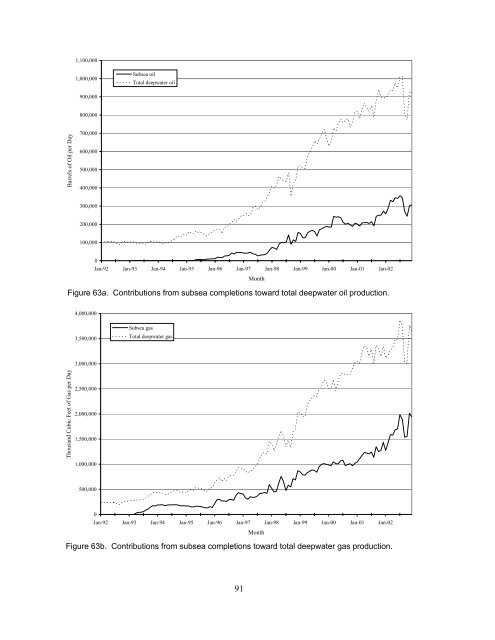
production and about 50 percent <strong>of</strong> deepwater gas production. Figure 63a shows that very little deepwater oil production came from subsea completions until mid-1995, but by the fall <strong>of</strong> 1996 that production had risen to about 20 percent. Since 2000, subsea oil production has increased slightly, whereas total deepwater oil production has increased dramatically. <strong>Deepwater</strong> gas production from subsea completions began in early 1993, and by mid-1994 they accounted for over 40 percent <strong>of</strong> deepwater GOM gas production (Figure 63b). Gas production from subsea completions increased from 1996 through 1999, remained constant in 2000, and increased rapidly after 2000. COMPANIES AND PRODUCTION <strong>Deepwater</strong> oil and gas production was confined almost entirely to major oil and gas companies through 1996 (figures 64a-b). (Production volumes in figures 64a-b, 65a-b, and 66a-b are attributed to companies on the basis <strong>of</strong> their percentage <strong>of</strong> lease ownership. For example, if Shell owned 75 percent <strong>of</strong> a particular lease in July 1997, then 75 percent <strong>of</strong> that lease’s production was attributed to Shell that month.) In 1998 and 1999, nonmajor companies significantly increased their deepwater oil production (figure 64a). However, since 2000, nonmajor oil production has leveled <strong>of</strong>f while major oil companies continued their steep increases in oil production. Gas production from nonmajor and major companies has increased at approximately the same rate (figure 64b). Nonmajor companies currently own about 25 percent <strong>of</strong> deepwater GOM oil production and 30 percent <strong>of</strong> gas production. In shallow water, nonmajor companies now produce more oil than the majors (figure 65a). In addition, nonmajor gas production represents an increasingly greater share <strong>of</strong> the total shallow-water gas production (figure 65b). This confirms the speculation that majors have been concentrating more in deepwater for their production needs. Figures 66a and 66b display production contributions from each major oil and gas company. Shell and BP were the driving forces behind increasing deepwater production, with Shell as the clear leader in both oil and gas production. Shell’s dominance in deepwater oil production began before 1992 and its recent increases have outpaced those <strong>of</strong> the other major companies. Shell also led in deepwater gas production, including a dramatic increase in 1997. BP oil production increased significantly since 1998 (in part because Shell and BP have joint ownership in several large deepwater fields). BP is second in terms <strong>of</strong> gas production because <strong>of</strong> steep increases in deepwater gas production since the last report. Note that BP has several significant projects on the horizon (e.g., Mad Dog, Thunder Horse, and Atlantis) that will contribute significantly to its oil and gas production totals. PRODUCTION RATES High well production rates have been a driving force behind the success <strong>of</strong> deepwater operations. Figure 67a illustrates the highest deepwater oil production rates (monthly production divided by actual production days). For example, a well within Shell’s Bullwinkle field produced about 5,000 BOPD in 1992. In 1994, a well within Shell’s Auger field set a record, producing about 10,000 BOPD. From 1994 through mid-1999, maximum deepwater oil production rates continued to climb, especially in water depths between 1,500 and 4,999 ft (457 and 1,524 m). Horn Mountain came on line in early 2002 in 5,400 ft (1,646 m) water depth with a single well maximum rate <strong>of</strong> more than 30,000 BOPD. The deepest production is currently held by Camden Hills in 7,216 ft (2,199 m) water depth. Figure 67b shows maximum production rates for gas. These rates hovered around 25 MMCFPD until a well in Shell’s Popeye field raised the deepwater production record to over 100 MMCFPD in 1996. Since then, the deepwater has yielded even higher maximum production rates. In 1997, Shell’s Mensa field (5,379 ft [1,640 m] water depth) showed the excellent potential for deepwater production rates beyond the 5,000 ft (1,524 m) water depth. The record daily oil and gas production rates (for a single well) are 41,532 BOPD (Troika) and 145 MMCFPD (Mica). 90
1,100,000 1,000,000 Subsea oil Total deepwater oil 900,000 800,000 Barrels <strong>of</strong> Oil per Day 700,000 600,000 500,000 400,000 300,000 200,000 100,000 0 Jan-92 Jan-93 Jan-94 Jan-95 Jan-96 Jan-97 Jan-98 Jan-99 Jan-00 Jan-01 Jan-02 Month Figure 63a. Contributions from subsea completions toward total deepwater oil production. 4,000,000 3,500,000 Subsea gas Total deepwater gas 3,000,000 Thousand Cubic Feet <strong>of</strong> Gas per Day 2,500,000 2,000,000 1,500,000 1,000,000 500,000 0 Jan-92 Jan-93 Jan-94 Jan-95 Jan-96 Jan-97 Jan-98 Jan-99 Jan-00 Jan-01 Jan-02 Month Figure 63b. Contributions from subsea completions toward total deepwater gas production. 91
- Page 2 and 3:
ON COVER - The cover features four
- Page 5 and 6:
Table of Contents Page PREFACE.....
- Page 7 and 8:
Figures Page Figure 1. The Gulf of
- Page 9 and 10:
Figures — continued Page Figure 5
- Page 11:
Tables Page Table 1 List of Deepwat
- Page 15 and 16:
INTRODUCTION The deepwater Gulf of
- Page 17 and 18:
BACKGROUND DEFINITIONS The GOM Oute
- Page 19 and 20:
EXPANDING FRONTIER When the origina
- Page 21 and 22:
1992 - 1993 Louisiana Mississippi A
- Page 23 and 24:
1992 - 2003 Texas Louisiana Mississ
- Page 25 and 26:
fffffffffffffffff 1500 ft Quaternar
- Page 27 and 28:
In addition to the traditional oil
- Page 29 and 30:
15 Figure 8. Gas hydrates on the se
- Page 31 and 32:
1998 - 1999 Louisiana Mississippi A
- Page 33 and 34:
4,500 4,000 Number of Active Leases
- Page 35 and 36:
ENVIRONMENTAL ACTIVITY The extensiv
- Page 37 and 38:
Operators submit a remotely operate
- Page 39 and 40:
25 Figure 15. Loop and eddy current
- Page 41 and 42:
1975 - 1979 Louisiana Mississippi A
- Page 43 and 44:
29 Deepwater Discoveries $ #Y Texas
- Page 45 and 46:
31 Texas ð PORT ARANSAS 1000 ft 15
- Page 47 and 48:
Louisiana Mississippi Alabama 33 Te
- Page 49 and 50:
Pipelines New pipelines Proposed pi
- Page 51 and 52:
LEASING Until the mid-1990's, leasi
- Page 53 and 54: Number of Leases Bid On 600 500 400
- Page 55 and 56: 1998 - 1999 Louisiana Mississippi A
- Page 57 and 58: 1992 - 1993 Louisiana Mississippi A
- Page 59 and 60: 2004 - 2005 (741 leases) Louisiana
- Page 61 and 62: DRILLING AND DEVELOPMENT Deepwater
- Page 63 and 64: 49 Figure 30. The Discoverer Deep S
- Page 65 and 66: 51 Number of Wells Spudded 250 200
- Page 67 and 68: 120 > 7,500 ft 107 108 100 5,000 -
- Page 69 and 70: 1998 - 1999 Louisiana Mississippi A
- Page 71 and 72: 1998 - 1999 Louisiana Mississippi A
- Page 73 and 74: 180 160 Deepwater EP Deepwater DOCD
- Page 75 and 76: 340 626 390 472 472 456 393 475 590
- Page 77 and 78: Year of First Production Table 4 De
- Page 79 and 80: Year of First Production Table 4 De
- Page 81 and 82: A predominant workhorse of the GOM
- Page 83 and 84: 3 Number Installed 2 1 0 2004 69 TL
- Page 85 and 86: Flow lines to host platform Subsea
- Page 87 and 88: 140 131 120 100 78 Number of Wells
- Page 89 and 90: RESERVES AND PRODUCTION The deepwat
- Page 91 and 92: 77 Million Barrels of Oil Equivalen
- Page 93 and 94: 18 16 14 12 10 8 Number of Fields 6
- Page 95 and 96: 81 Million Barrels of Oil Equivalen
- Page 97 and 98: 45,000 40,000 Million Barrels Oil E
- Page 99 and 100: 1992-1993 1994-1995 1996-1997 Lease
- Page 101 and 102: S hallo w- wa ter GOM 11% Deepwater
- Page 103: 1,200,000 1,000,000 Total productio
- Page 107 and 108: 900,000 800,000 Majors Nonmajors 70
- Page 109 and 110: 45,000 40,000 Max oil rate 1,000-1,
- Page 111 and 112: 4,000 3,500 Shallow water Deepwater
- Page 113 and 114: Texas Auger Louisiana SS182 Troika
- Page 115 and 116: SUMMARY AND CONCLUSIONS This report
- Page 117 and 118: 2,500 Number of leases Average U.S.
- Page 119 and 120: Number of Years 14 12 leas es in p
- Page 121 and 122: data for this analysis include only
- Page 123 and 124: 80 2500 70 60 Number of leases dril
- Page 125 and 126: 4,500 4,000 3,500 Leases tested Lea
- Page 127: • Nonmajor companies have made mo
- Page 131: REFERENCES Bascle, B. J., L. D. Nix
- Page 134 and 135: Project Name Area/Block Water Depth
- Page 136 and 137: Project Name Area/Block Water Depth
- Page 138 and 139: Project Name Area/Block Water Depth
- Page 140 and 141: Project Name Area/Block Water Depth
- Page 142 and 143: Project Name Area/Block Water Depth
- Page 144 and 145: Project Name Area/Block Water Depth
- Page 146 and 147: Sale Number Sale Location Sale Date
- Page 148 and 149: Completed Studies [MMS Study Number
- Page 150 and 151: Group Name Company Name MMS Number
- Page 152 and 153: Group Name Company Name MMS Number
- Page 154 and 155:
Appendix G. Subsea Completions. Are
- Page 156 and 157:
Area Block API Number Operator Comp
- Page 158 and 159:
Area Block API Number Operator 144
- Page 160 and 161:
Area Block API Number Operator Comp
- Page 162 and 163:
Area Block API Number Operator Comp
- Page 164 and 165:
Year Shallowwater Oil (MBOPD) Deepw