OUR TOWN
FY 2012 - Millbury, MA
FY 2012 - Millbury, MA
- No tags were found...

Create successful ePaper yourself
Turn your PDF publications into a flip-book with our unique Google optimized e-Paper software.
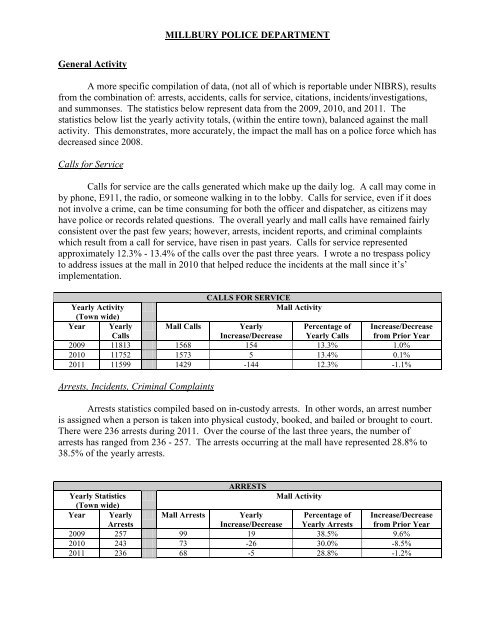
MILLBURY POLICE DEPARTMENT<br />
General Activity<br />
A more specific compilation of data, (not all of which is reportable under NIBRS), results<br />
from the combination of: arrests, accidents, calls for service, citations, incidents/investigations,<br />
and summonses. The statistics below represent data from the 2009, 2010, and 2011. The<br />
statistics below list the yearly activity totals, (within the entire town), balanced against the mall<br />
activity. This demonstrates, more accurately, the impact the mall has on a police force which has<br />
decreased since 2008.<br />
Calls for Service<br />
Calls for service are the calls generated which make up the daily log. A call may come in<br />
by phone, E911, the radio, or someone walking in to the lobby. Calls for service, even if it does<br />
not involve a crime, can be time consuming for both the officer and dispatcher, as citizens may<br />
have police or records related questions. The overall yearly and mall calls have remained fairly<br />
consistent over the past few years; however, arrests, incident reports, and criminal complaints<br />
which result from a call for service, have risen in past years. Calls for service represented<br />
approximately 12.3% - 13.4% of the calls over the past three years. I wrote a no trespass policy<br />
to address issues at the mall in 2010 that helped reduce the incidents at the mall since it’s’<br />
implementation.<br />
CALLS FOR SERVICE<br />
Mall Activity<br />
Yearly Activity<br />
(Town wide)<br />
Year Yearly Mall Calls Yearly<br />
Percentage of<br />
Calls<br />
Increase/Decrease Yearly Calls<br />
2009 11813 1568 154 13.3% 1.0%<br />
2010 11752 1573 5 13.4% 0.1%<br />
2011 11599 1429 -144 12.3% -1.1%<br />
Arrests, Incidents, Criminal Complaints<br />
Increase/Decrease<br />
from Prior Year<br />
Arrests statistics compiled based on in-custody arrests. In other words, an arrest number<br />
is assigned when a person is taken into physical custody, booked, and bailed or brought to court.<br />
There were 236 arrests during 2011. Over the course of the last three years, the number of<br />
arrests has ranged from 236 - 257. The arrests occurring at the mall have represented 28.8% to<br />
38.5% of the yearly arrests.<br />
ARRESTS<br />
Yearly Statistics<br />
Mall Activity<br />
(Town wide)<br />
Year Yearly<br />
Arrests<br />
Mall Arrests Yearly<br />
Increase/Decrease<br />
Percentage of<br />
Yearly Arrests<br />
Increase/Decrease<br />
from Prior Year<br />
2009 257 99 19 38.5% 9.6%<br />
2010 243 73 -26 30.0% -8.5%<br />
2011 236 68 -5 28.8% -1.2%