Cockle Cove Salt Marsh Plants&Inverts 08/05 - Town to Chatham
Cockle Cove Salt Marsh Plants&Inverts 08/05 - Town to Chatham
Cockle Cove Salt Marsh Plants&Inverts 08/05 - Town to Chatham
- No tags were found...

Create successful ePaper yourself
Turn your PDF publications into a flip-book with our unique Google optimized e-Paper software.
<strong>Cockle</strong> <strong>Cove</strong> <strong>Salt</strong> <strong>Marsh</strong><br />
<strong>Chatham</strong>, MA<br />
Plant and Invertebrate Surveys<br />
August 20<strong>05</strong><br />
Investigation Report<br />
MA Office of Coastal Zone Management
Contents<br />
Background ..................................................................................................................... 2<br />
Methods .......................................................................................................................... 3<br />
Observations and comments........................................................................................... 4<br />
Results ............................................................................................................................ 5<br />
Appendix A: ............................................................................................................... 10<br />
Appendix B: ............................................................................................................... 12<br />
Appendix C: ............................................................................................................... 14<br />
List of Figures<br />
Figure 1. Study site with evaluation areas, and location of random transects. ................ 4<br />
Figure 2. MDS graph of plant plots.................................................................................. 8<br />
Figure 3. MDS graph of plant transects........................................................................... 8<br />
Figure 4. MDS graph of invertebrate transects................................................................ 9<br />
List of Tables<br />
Table 1. Complete plant species list with <strong>to</strong>tal and percent cover abundances.............. 6<br />
Table 2. Complete invertebrate taxa list with <strong>to</strong>tal and percent cover abundances........ 7<br />
Carlisle, B.K. and J.P. Smith. 20<strong>05</strong>. Investigation Report : Plant and Invertebrate<br />
Surveys, <strong>Cockle</strong> <strong>Cove</strong> <strong>Salt</strong> <strong>Marsh</strong>, <strong>Chatham</strong>, MA, August 20<strong>05</strong>. MA Office of Coastal<br />
Zone Management, Bos<strong>to</strong>n.<br />
<strong>Cockle</strong> <strong>Cove</strong> <strong>Salt</strong> <strong>Marsh</strong> Plants and <strong>Inverts</strong> Survey: CZM August 20<strong>05</strong> 2
Background<br />
Massachusetts Office of Coastal Zone Management (CZM) offered assistance <strong>to</strong> the<br />
Department of Environmental Protection (DEP), the <strong>Town</strong> of <strong>Chatham</strong> (the <strong>Town</strong>), and<br />
the University of Massachusetts’ School for Marine Science and Technology (SMAST)<br />
in their work on a baseline assessment of the salt marsh system in <strong>Cockle</strong> <strong>Cove</strong> and<br />
upper Bucks Creek. The assessment is part of a Total Maximum Daily Load (TMDL)<br />
process in order <strong>to</strong> the effects of nitrogen loading from a potential increase in discharge<br />
from the <strong>Town</strong>’s wastewater treatment plant<br />
CZM’s portion of the assessment was a detailed survey of the plants on the marsh plain<br />
and a [semi-quantitative] survey of invertebrates on the creek bank. The methods and<br />
results are described in this report. The pro<strong>to</strong>cols for plants survey are consistent with<br />
those in the US Environmental Protection Agency-approved Cape Cod <strong>Salt</strong> <strong>Marsh</strong><br />
Ecological Assessment Project Quality Assurance Project Plan: FINAL June 5, 2000,<br />
Massachusetts Coastal Zone Management.<br />
Methods<br />
Twelve transects were established as the basis <strong>to</strong> survey salt marsh vegetation and<br />
creek-bank aquatic macro-invertebrates. The location of the transects was determined<br />
according <strong>to</strong> the following pro<strong>to</strong>col. The <strong>Cockle</strong> <strong>Cove</strong> system was segmented in<strong>to</strong> three<br />
sections or evaluation areas. In each of the sections, four transects were placed, two<br />
on each side of a primary channel, for a <strong>to</strong>tal of 12 transects The transect locations<br />
were random, determined by generating a random integer between 0 and 100 according<br />
<strong>to</strong> a random number algorithm. The random integer was the percent of the <strong>to</strong>tal<br />
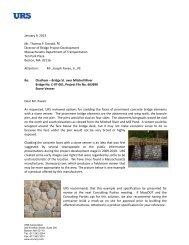
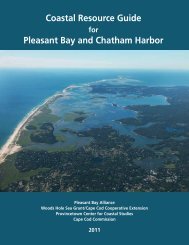
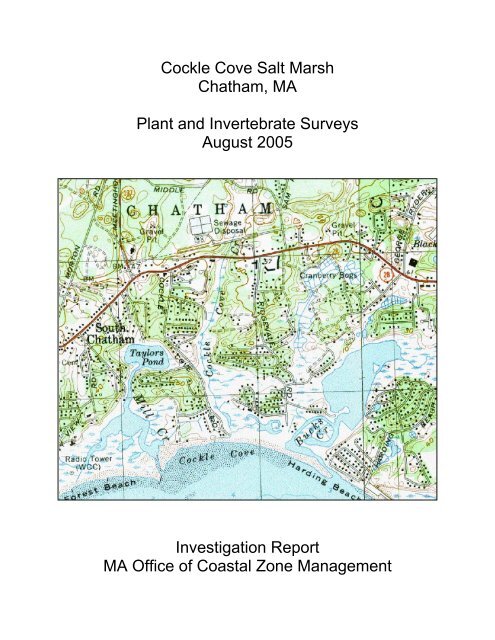
distance in meters of each evaluation section. Figure 1 shows a map of the <strong>Cockle</strong><br />
<strong>Cove</strong> salt marsh site with the layout of the three sections and 12 randomly placed<br />
survey transects.<br />
The transects were oriented <strong>to</strong> run from the bank <strong>to</strong> the upland edge. Along each<br />
transect, 1m 2 plots were located at 20m intervals, with the first plot at the creek bank,<br />
and plots continuing until the end of the transect, generally in the marsh fringe or<br />
terrestrial transition border community. If the last plot in the 20m interval scheme fell<br />
outside the salt marsh wetland in the upland, the plot location was pulled back along the<br />
transect until it fell within the wetland and the new plot location was recorded.<br />
In each plot, every plant (macrophytes) was identified <strong>to</strong> species and denoted on the<br />
field data sheet. For each species within the plot, the overall abundance in the 1m 2 plot<br />
was determined by comparing the visual estimates of the two investiga<strong>to</strong>rs and then<br />
applying a standard cover class value for nine coverage ranges. The standard cover<br />
class categories are contained in Appendix A. This cover class was recorded on the<br />
field data sheet. <strong>Cove</strong>rage estimates included the following non-macrophyte items,<br />
cumulatively classified in<strong>to</strong> the category “other”: algae, wrack, dead plant litter, bare<br />
ground/mud, and open water.<br />
<strong>Cockle</strong> <strong>Cove</strong> <strong>Salt</strong> <strong>Marsh</strong> Plants and <strong>Inverts</strong> Survey: CZM August 20<strong>05</strong> 3
Figure 1. Study site with evaluation areas, and location of random transects.<br />
At each of the creek-bank 1m 2 plots on the twelve transects, a survey of aquatic macroinvertebrates<br />
was conducted according <strong>to</strong> the following pro<strong>to</strong>col: All visible macroinvertebrates<br />
(i.e. crabs, snails, bivalves, amphipods and isopods) were identified <strong>to</strong> the<br />
lowest taxonomic level possible and each individual counted.<br />
The survey was conducted on August 15 th , 20<strong>05</strong>.<br />
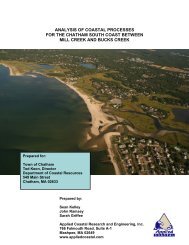
Observations and comments<br />
Field work on the survey date (<strong>08</strong>/15/<strong>05</strong>) started at <strong>08</strong>:00AM just before high tide. A<br />
team of two investiga<strong>to</strong>rs spent an hour circum-navigating the marsh, considering the<br />
layout of the randomly generated transects and determining the points of access for the<br />
survey. Survey work started about 09:00AM at the upper marsh and the transects were<br />
surveyed from landward <strong>to</strong> seaward, ending about 04:00PM.<br />
<strong>Cockle</strong> <strong>Cove</strong> <strong>Salt</strong> <strong>Marsh</strong> Plants and <strong>Inverts</strong> Survey: CZM August 20<strong>05</strong> 4
The <strong>Cockle</strong> <strong>Cove</strong> / Buck’s Creek <strong>Salt</strong> <strong>Marsh</strong> would be considered <strong>to</strong> be a typical salt<br />
marsh of southern New England. Characterized by large areas of marsh plain<br />
intersected by natural sinuous creeks and manmade ditches, the salt marsh was<br />
comprised of the typical low marsh, high marsh, and marsh/terrestrial border<br />
communities. The site is surrounded on all sides by medium <strong>to</strong> high density residential<br />
development and two lane suburban access roads with little or no shoulder.<br />
Some observations from the investiga<strong>to</strong>rs included:<br />
At low tide, there is considerable freshwater flow in the creek channel network.<br />
There are some large panne areas in the lower marsh (the seaward end) that do<br />
not appear in the 2001 ortho imagery and could indicate recent trajec<strong>to</strong>ry <strong>to</strong>ward<br />
marsh surface degradation.<br />
There are some stands of Phragmites australis—the largest being in the marsh<br />
“finger” on the east side. Transects 7 and 8 picked up only the edges of this<br />
large stand, so that the <strong>to</strong>tal abundance reported in the Results section is likely<br />
an under-representation (but statistically valid).<br />
There was a distinct, extremely strong odor of sulfur in this same area. Both<br />
investiga<strong>to</strong>rs who regularly spend significant time conducting similar field work in<br />
Massachusetts salt marshes noted that this was particularly strong (offensive)<br />
and definitely not the characteristic “low tide” odor.<br />
Wildlife observations in the marsh and its buffer included a snapping turtle (and a<br />
turtle carcass), bullfrogs, shorebirds (least sandpiper, semi-palmated plover,<br />
semi-palmated sandpiper), black-backed gull, herring gull, least and common<br />
terns, and numerous songbirds and neo-tropical migrants.<br />
We were approached by numerous residents (and visi<strong>to</strong>rs) asking about our<br />
work. There was a definite sense of concern and appreciation for baseline study.<br />
Results<br />
The survey consisted of 12 transects and 39 <strong>to</strong>tal plots. 33 different species of plants<br />
were surveyed in the study plots. Spartina alterniflora (both tall and short forms) was<br />
the dominant species (17.3 % and 8.6% respectively), followed by the high marsh turf<br />
grasses, Distichlis spicata (8.4%) and Spartina patens (7.7%). Also in the <strong>to</strong>p ten<br />
percent were the brackish Typha angustifolia (6.9%) and the invasive Phragmites<br />
australis (1.8%). The species list, <strong>to</strong>tal and percent <strong>to</strong>tal abundance values are listed in<br />
Table 1. The complete list of species and abundances by transect in included on<br />
Appendix B.<br />
This site has a particularly high level of plant diversity for a salt marsh system which can<br />
be attributed <strong>to</strong> large numbers of brackish and terrestrial border species. Much of the<br />
marsh perimeter seems <strong>to</strong> be the interface for local water table, creating fresher edges<br />
where species like Typha angustifolia, Scirpus pungens, Scirpus robustus, and Spartina<br />
cynosuroides hold their niches. In addition, there are areas on the upper marsh plain<br />
behind the former dike (landward section including transects 1-4) where marsh<br />
elevation is obviously higher and supports salt marsh terrestrial border species like<br />
<strong>Cockle</strong> <strong>Cove</strong> <strong>Salt</strong> <strong>Marsh</strong> Plants and <strong>Inverts</strong> Survey: CZM August 20<strong>05</strong> 5
Solidago sempirvirens, Agropyron pungens, Panicum virgatum, and Festuca rubra. No<br />
floating algal mats occurred in the survey plots, although a couple small mats were seen<br />
on the marsh plain and would not be considered <strong>to</strong> be of concern.<br />
Table 1. Complete plant species list with <strong>to</strong>tal and percent cover abundances.<br />
Genus species<br />
Total <strong>Cove</strong>r Percent <strong>Cove</strong>r<br />
Spartina alterniflora 716 17.30<br />
Spartina alterniflora (short form) 356 8.60<br />
Distichlis spicata 346 8.36<br />
Spartina patens 319 7.71<br />
Typha angustifolia 286 6.91<br />
Juncus gerardii 262 6.33<br />
Solidago sempirvirens 232 5.61<br />
Iva frutescens 125 3.02<br />
Phragmites australis 76 1.84<br />
Scirpus pungens 75 1.81<br />
Agropyron pungens 61 1.47<br />
Scirpus robustus 55 1.33<br />
Toxicodendron radicans 44 1.06<br />
Panicum virgatum 42 1.01<br />
Agalinis maritime 29 0.70<br />
Salicornia europaea 18 0.43<br />
Suaeda linearis 18 0.43<br />
Ilex verticilatta 15 0.36<br />
Festuca rubra 14 0.34<br />
Spartina cynosuroides 13 0.31<br />
Parthenocissus quinquefolia 7 0.17<br />
Rosa palustris 7 0.17<br />
Atriplex patula 6 0.14<br />
Galium tinc<strong>to</strong>rium 4 0.10<br />
Pluchea purpurascens 4 0.10<br />
Althaea officinalis 3 0.07<br />
Aster sp. 3 0.07<br />
Calystegia sepium 3 0.07<br />
Glaux maritima 3 0.07<br />
Leersia oryzoides 3 0.07<br />
Myrica gale 3 0.07<br />
Plantago maritima 3 0.07<br />
Limonium nashii 1 0.02<br />
Polygonum punctatum 1 0.02<br />
Other (bare ground, dead plant, water) 985 23.80<br />
Only four taxa of macro-invertebrates were surveyed in the 12 study plots. The most<br />
common was the marsh snail, Melampus bidentatus (73.1%), with the ribbed mussel,<br />
Geukensia demissa (24.4%), essentially comprising the rest of the invertebrate<br />
<strong>Cockle</strong> <strong>Cove</strong> <strong>Salt</strong> <strong>Marsh</strong> Plants and <strong>Inverts</strong> Survey: CZM August 20<strong>05</strong> 6
community. Several individual isopods and fiddler crabs (either Uca pugila<strong>to</strong>r or Uca<br />
pugnax) were surveyed. It is important <strong>to</strong> note that the survey was on the marsh<br />
surface and vegetation only and did not include substrate removal. There was<br />
significant evidence of Uca burrows, but the presence of crabs in each burrow was not<br />
part of the scope of work and was not determined. The taxa list, <strong>to</strong>tal and percent <strong>to</strong>tal<br />
abundance values are listed in Table 2. The complete list of species and abundances<br />
by transect in included on Appendix C.<br />
Table 2. Complete invertebrate taxa list with <strong>to</strong>tal and percent cover abundances.<br />
Taxa Total abundance Percent Abundance<br />
Melampus bidentus 510 73.07<br />
Geukensia demissa 169 24.21<br />
Uka sp 7 1.00<br />
Unknown isopod 12 1.72<br />
If there is serious concern regarding potential effects of increased nitrogen <strong>to</strong> the<br />
macro-invertebrate communities, we would recommend a more detailed survey be<br />
conducted and include substrate (sediment) samples from the creek bank and the creek<br />
bot<strong>to</strong>m, along with water column samples during flood (mid-tide) conditions.<br />
In an effort <strong>to</strong> examine the effects of two landscape patterns—the landward - seaward<br />
gradients and the creek bank - upland gradient—on the data, discriminate analyses<br />
were conducted. Multi-variate software (Primer, version 5.2.9) was used <strong>to</strong> run<br />
standard routines. Bray-Curtis similarity matrices were created for the plant data using<br />
the plots as the sample and then using transects as the sample. Using the Bray-Curtis<br />
similarity coefficients, a graphical representation of the results was generated. These<br />
multi-dimensional scaling (MDS) graphs show the similarities between samples plotted<br />
as the distance between points, so that the more similar two sample points are, the<br />
closer they will be <strong>to</strong>gether (and the more different the farther apart).<br />
Figure 2 shows the MDS graph for the plant plots, with different symbols for the location<br />
of the plots: either low marsh (at the creek bank), high marsh (on the marsh platform or<br />
plain), or fringe (at the marsh/terrestrial border). Clearly there is more separation of the<br />
three groups (or communities) than shared area (note that two samples have been<br />
designated as outliers). This analysis demonstrates reasonable discrimination between<br />
the three marsh community types on a gradient from creek bank <strong>to</strong> upland edge.<br />
In Figure 3 the MDS graph for the plant data using the transects as samples is shown.<br />
Here the value markers are shown for position on the marsh gradient from seaward <strong>to</strong><br />
<strong>Cockle</strong> <strong>Cove</strong> <strong>Salt</strong> <strong>Marsh</strong> Plants and <strong>Inverts</strong> Survey: CZM August 20<strong>05</strong> 7
Stress: 0.2<br />
6-20<br />
10-40 8-20<br />
9-20<br />
3-20 12-65<br />
6-40<br />
11-44<br />
6-602-60<br />
2-20<br />
1-14<br />
low<br />
12-60<br />
6-80<br />
2-40<br />
10-20<br />
7-20<br />
2-80<br />
2-93<br />
4-2<strong>05</strong>-20<br />
6-99<br />
4-31<br />
high<br />
2-0<br />
1-0 12-20 11-20 12-40 11-40<br />
4-0<br />
8-0<br />
9-0 3-0<br />
10-0<br />
12-0 11-0 7-0<br />
fringe<br />
5-0 6-0<br />
Figure 2. MDS graph of plant plots.<br />
Stress: 0.16<br />
2<br />
6<br />
upper<br />
1<br />
9<br />
3<br />
8<br />
10<br />
12<br />
11<br />
mid<br />
4<br />
7<br />
lower<br />
5<br />
Figure 3. MDS graph of plant transects.<br />
landward: either lower (for transects located in the seaward portion of the marsh), mid<br />
(for transects in middle of the marsh), and upper (for transects in the upper or landward<br />
portions). Here <strong>to</strong>o, we do see separation between the upper and lower transects<br />
(excepting transect 10), but the analysis cannot discriminate mid-marsh located<br />
<strong>Cockle</strong> <strong>Cove</strong> <strong>Salt</strong> <strong>Marsh</strong> Plants and <strong>Inverts</strong> Survey: CZM August 20<strong>05</strong> 8
transects however, with transect 5 having more similarity <strong>to</strong> the upper marsh transects<br />
and transect 6 <strong>to</strong> the lower.<br />
For the invertebrates, since survey samples were only conducted at the creek-bank and<br />
not out on<strong>to</strong> the marsh plain, the discrimination would only be for marsh location on the<br />
seaward-landward gradient. Figure 4 shows the MDS graph for the invertebrate data<br />
using transect location as the discrimina<strong>to</strong>ry variable. Here, again, we see reasonable<br />
separation, with the exception of a lower marsh outlier (transect 9).<br />
Stress: 0<br />
1<br />
2<br />
7 8 9<br />
4<br />
3<br />
6<br />
11<br />
upper<br />
10<br />
12<br />
mid<br />
5<br />
lower<br />
Figure 4. MDS graph of invertebrate transects.<br />
The practical application of this multi-variate analysis would be <strong>to</strong> see over time, with<br />
the effects of added nitrogen <strong>to</strong> the system, if the plant and invertebrate assemblages<br />
for plots and transects shifted. If the communities became more homogenous, say due<br />
<strong>to</strong> loss if species diversity and shift <strong>to</strong> greater abundance of Spartina alterniflora,<br />
Phragmites australis, or Typha sp., we would see less separation both in terms of the<br />
creek bank - upland gradient as well as the seaward - landward gradient<br />
In conclusion, we would not consider the site—in its current state—<strong>to</strong> be a degraded<br />
system. The plant data from our survey indicates a typical salt marsh system. Higher<br />
elevations on the upper (landward area) marsh plain and freshwater table seeps at the<br />
perimeters give the system a high number and moderate abundance of plant species.<br />
We would mention that there are two dynamics we’d recommend watching for: (1) the<br />
spread of the large Phragmites stand in the eastern “finger” and (2) the rate and extent<br />
of short-form Spartina alterniflora and unvegetated marsh pannes. We would<br />
recommend long-term moni<strong>to</strong>ring (surveying) of the plant communities at a frequency of<br />
every 2-3 years.<br />
<strong>Cockle</strong> <strong>Cove</strong> <strong>Salt</strong> <strong>Marsh</strong> Plants and <strong>Inverts</strong> Survey: CZM August 20<strong>05</strong> 9
Appendix A:<br />
Standard <strong>Cove</strong>r Classes and Midpoints<br />
For <strong>Salt</strong> <strong>Marsh</strong> Plant Survey<br />
<strong>Cockle</strong> <strong>Cove</strong> <strong>Salt</strong> <strong>Marsh</strong> Plants and <strong>Inverts</strong> Survey: CZM August 20<strong>05</strong> 10
<strong>Salt</strong> <strong>Marsh</strong> Vegetation Survey<br />
Standard <strong>Cove</strong>r Classes and Midpoints for Estimating Abundance<br />
One method for obtaining abundance values for vegetation surveys is <strong>to</strong> estimate the<br />
percent of a plot occupied by the target plant. To assess percent cover, one estimates<br />
the area of the plot frame (1m 2 ) that is covered by all of the leaves, branches, and stems<br />
of the target species. Visual estimates may vary from one person <strong>to</strong> another. This<br />
variability can be significantly reduced by using standard cover classes and midpoint<br />
abundance values. The following figures illustrate 9 standard cover classes <strong>to</strong> use. For<br />
each plot, first identify and list the species present, then for each species determine<br />
which figure best describes its cover. Record the midpoint value on the data sheet.<br />
(Trace <strong>to</strong> 1%)<br />
Use 1%<br />
(11% <strong>to</strong> 19%)<br />
Use midpoint 15%<br />
(46% <strong>to</strong> 64%)<br />
Use midpoint 55%<br />
(2% <strong>to</strong> 4%)<br />
Use midpoint 3%<br />
(20% <strong>to</strong> 30%)<br />
Use midpoint 25%<br />
(65% <strong>to</strong> 87%)<br />
Use midpoint 76%<br />
(5% <strong>to</strong> 10%)<br />
Use midpoint 7%<br />
(31% <strong>to</strong> 45%)<br />
Use midpoint 38%<br />
(88% <strong>to</strong> 100%)<br />
Use midpoint 94%<br />
<strong>Cockle</strong> <strong>Cove</strong> <strong>Salt</strong> <strong>Marsh</strong> Plants and <strong>Inverts</strong> Survey: CZM August 20<strong>05</strong> 11
Appendix B:<br />
Plant data: abundance values by transect<br />
<strong>Cockle</strong> <strong>Cove</strong> <strong>Salt</strong> <strong>Marsh</strong> Plants and <strong>Inverts</strong> Survey: CZM August 20<strong>05</strong> 12
Transects<br />
Variability<br />
Genus species<br />
1 2 3 4 5 6 7 8 9 10 11 12 SD SE<br />
Agalinis maritima<br />
0 0 0 0 0 0 0 0 1 3 0 25 7.17 2.07<br />
Agropyron pungens<br />
0 0 3 0 0 0 0 0 0 0 3 55 15.76 4.55<br />
Althaea officinalis<br />
0 0 0 0 3 0 0 0 0 0 0 0 0.87 0.25<br />
Aster sp. 0 0 0 0 0 0 0 0 0 0 0 3 0.87 0.25<br />
Atriplex patula<br />
0 3 0 0 0 0 0 0 3 0 0 0 1.17 0.34<br />
Calystegia sepium<br />
1 0 1 0 0 0 0 0 0 0 0 1 0.45 0.13<br />
Distichlis spicata<br />
0 85 3 0 0 228 0 7 3 10 7 3 67.<strong>05</strong> 19.36<br />
Festuca rubra<br />
0 3 0 0 0 0 0 7 3 1 0 0 2.17 0.63<br />
Galium tinc<strong>to</strong>rium<br />
0 3 0 1 0 0 0 0 0 0 0 0 0.89 0.26<br />
Glaux maritima<br />
0 0 0 0 0 0 0 0 0 3 0 0 0.87 0.25<br />
Ilex verticilatta<br />
0 15 0 0 0 0 0 0 0 0 0 0 4.33 1.25<br />
Iva frutescens<br />
0 1 0 0 0 38 0 15 15 1 55 0 18.14 5.24<br />
Juncus gerardii<br />
0 3 0 0 0 83 0 0 76 38 7 55 32.29 9.32<br />
Leersia oryzoides<br />
0 0 0 3 0 0 0 0 0 0 0 0 0.87 0.25<br />
Limonium nashii<br />
0 0 0 0 0 0 0 0 0 0 0 1 0.29 0.<strong>08</strong><br />
Myrica gale<br />
0 0 0 3 0 0 0 0 0 0 0 0 0.87 0.25<br />
Other 22 129 30 95 45 95 110 40 40 68 156 155 48.18 13.91<br />
Panicum virgatum<br />
3 0 38 0 0 0 0 1 0 0 0 0 10.90 3.15<br />
Parthenocissus quinquefolia 0 0 0 0 0 0 0 0 0 0 0 7 2.02 0.58<br />
Phragmites australis 0 7 0 0 0 7 55 7 0 0 0 0 15.64 4.51<br />
Plantago maritime<br />
0 0 0 0 0 0 0 0 0 0 0 3 0.87 0.25<br />
Pluchea purpurascens 0 3 0 0 0 0 1 0 0 0 0 0 0.89 0.26<br />
Polygonum punctatum 0 1 0 0 0 0 0 0 0 0 0 0 0.29 0.<strong>08</strong><br />
Rosa palustris 7 0 0 0 0 0 0 0 0 0 0 0 2.02 0.58<br />
Salicornia europaea<br />
1 0 0 3 0 1 0 0 4 4 1 4 1.73 0.50<br />
Scirpus pungens<br />
25 33 7 0 0 0 0 7 0 3 0 0 11.09 3.20<br />
Scirpus robustus<br />
0 0 0 0 0 55 0 0 0 0 0 0 15.88 4.58<br />
Solidago sempirvirens 25 80 38 0 0 19 0 25 7 25 0 13 22.99 6.64<br />
Spartina alterniflora<br />
0 0 76 55 94 94 55 76 38 76 76 76 32.09 9.26<br />
Spartina alterniflora (short) 76 22 0 0 0 0 1 0 0 15 110 132 48.10 13.88<br />
Spartina cynosuroides 7 0 0 0 0 0 0 0 0 0 3 3 2.19 0.63<br />
Spartina patens 3 169 6 25 0 0 7 32 38 39 0 0 47.47 13.70<br />
Suaeda linearis<br />
0 0 0 0 0 0 0 0 3 0 15 0 4.34 1.25<br />
Toxicodendron radicans 25 0 0 3 1 0 0 15 0 0 0 0 7.97 2.30<br />
Typha angustifolia 0 93 0 131 55 7 0 0 0 0 0 0 44.79 12.93<br />
<strong>Cockle</strong> <strong>Cove</strong> <strong>Salt</strong> <strong>Marsh</strong> Plants and <strong>Inverts</strong> Survey: CZM August 20<strong>05</strong> 13
Appendix C:<br />
Invertebrate data: abundance values by transect<br />
<strong>Cockle</strong> <strong>Cove</strong> <strong>Salt</strong> <strong>Marsh</strong> Plants and <strong>Inverts</strong> Survey: CZM August 20<strong>05</strong> 14
Transects<br />
Variability<br />
Taxa<br />
1 2 3 4 5 6 7 8 9 10 11 12 SD SE<br />
Melampus bidentus 28 67 76 118 22 152 2 3 39 0 3 0 50.84 14.68<br />
Geukensia demissa 0 0 5 4 9 48 0 0 0 14 57 32 20.26 5.85<br />
Uka sp<br />
0 0 0 0 7 0 0 0 0 0 0 0 2.02 0.58<br />
Unknown isopod 0 0 0 0 5 0 0 0 7 0 0 0 2.37 0.69<br />
<strong>Cockle</strong> <strong>Cove</strong> <strong>Salt</strong> <strong>Marsh</strong> Plants and <strong>Inverts</strong> Survey: CZM August 20<strong>05</strong> 15