Coastal Resource Guide Pleasant Bay and Chatham Harbor
Coastal Resource Guide Pleasant Bay and ... - Town to Chatham
Coastal Resource Guide Pleasant Bay and ... - Town to Chatham

Create successful ePaper yourself
Turn your PDF publications into a flip-book with our unique Google optimized e-Paper software.
<strong>Coastal</strong> <strong>Resource</strong> <strong>Guide</strong> for <strong>Pleasant</strong> <strong>Bay</strong> <strong>and</strong> <strong>Chatham</strong> <strong>Harbor</strong><br />
<strong>Coastal</strong> <strong>Resource</strong> <strong>Guide</strong><br />
for<br />
<strong>Pleasant</strong> <strong>Bay</strong> <strong>and</strong> <strong>Chatham</strong> <strong>Harbor</strong><br />
<strong>Pleasant</strong> <strong>Bay</strong> Alliance 2011<br />
<strong>Pleasant</strong> <strong>Bay</strong> Alliance<br />
Woods Hole Sea Grant/Cape Cod Cooperative Extension<br />
Provincetown Center for <strong>Coastal</strong> Studies<br />
Cape Cod Commission<br />
2011
<strong>Coastal</strong> <strong>Resource</strong> <strong>Guide</strong> for <strong>Pleasant</strong> <strong>Bay</strong> <strong>and</strong> <strong>Chatham</strong> <strong>Harbor</strong><br />
Acknowledgements<br />
The <strong>Coastal</strong> <strong>Resource</strong> <strong>Guide</strong> for <strong>Pleasant</strong> <strong>Bay</strong> <strong>and</strong> <strong>Chatham</strong> <strong>Harbor</strong> is a production of the <strong>Pleasant</strong> <strong>Bay</strong> Alliance in partnership with the<br />
Cape Cod Commission, Woods Hole Sea Grant Program/Cape Cod Cooperative Extension, Provincetown Center for <strong>Coastal</strong> Studies <strong>and</strong><br />
Massachusetts <strong>Coastal</strong> Zone Management. Each organization contributed funding, technical support, <strong>and</strong>/or in-kind support.<br />
Appreciation <strong>and</strong> special recognition are owed to many individuals who contributed substantially to the development of the guide. A brief<br />
description of these important contributions is provided below.<br />
The following contributors developed maps <strong>and</strong> figures that appear throughout the guide:<br />
Greg Berman, Cape Cod Cooperative Extension/Woods Hole Sea Grant Program<br />
Mark Borrelli, Provincetown Center for <strong>Coastal</strong> Studies<br />
Graham Giese, Provincetown Center for <strong>Coastal</strong> Studies<br />
Paul Lagg, Town of <strong>Chatham</strong><br />
Anne Reynolds, Cape Cod Commission.<br />
The following individuals participated in drafting sections of the guide:<br />
Greg Berman; Mark Borrelli; Graham Giese; Ted Keon, Town of <strong>Chatham</strong>; Steve McKenna, MA <strong>Coastal</strong> Zone Management; Carole Ridley;<br />
Andy Walsh, Cape Cod Commission.<br />
Many drafts of the sections, along with figures <strong>and</strong> maps, were painstakingly reviewed by the contributors noted above, <strong>and</strong> by other<br />
members of the <strong>Pleasant</strong> <strong>Bay</strong> Alliance <strong>Coastal</strong> <strong>Resource</strong> Work Group: Judith Bruce, George Cooper, Jane Harris, Fran McClennen, Chris<br />
Miller <strong>and</strong> Allin Thompson.<br />
The guide was edited by Carole Ridley, Alliance Coordinator. Production assistance was generously provided by Jeffrey Brodeur, Woods<br />
Hole Sea Grant Program. Design <strong>and</strong> layout by Lianne Dunn. Cover photo: Kelsey-Kennard Airview © www.capecodphotos.com<br />
Tables, Figures, Maps<br />
Page List of Tables<br />
6 Table 1. Breakdown of Digitized Aerial Photographs<br />
19 Table 2. Erosion Control Structures on <strong>Pleasant</strong> <strong>Bay</strong><br />
25 Table 3. <strong>Coastal</strong> Wetl<strong>and</strong> <strong>Resource</strong> Areas <strong>and</strong> Freshwater<br />
Wetl<strong>and</strong>s in the <strong>Pleasant</strong> <strong>Bay</strong> Study Area<br />
31 Table 4. Statistically Significant Trends in Water Quality<br />
34 Table 5. Controlling Depths in <strong>Pleasant</strong> <strong>Bay</strong><br />
34 Table 6. Estimated Dredge Volumes<br />
List of Figures<br />
3 Figure 1. Projected Changes in Nauset Beach <strong>and</strong> Inlet System<br />
4 Figure 2. Successive Morphological Changes in Nauset Beach<br />
5 Figure 3. Meetinghouse Pond Mean Monthly Tides<br />
7 Figure 4. Coverage Map of LIDAR collected in 1998,<br />
2000, 2007<br />
8 Figure 5. Change over time between LIDAR collection events<br />
9 Figure 6. <strong>Chatham</strong> Inlet Development 2006-2010<br />
11 Figure 7. Wind Wave Rose for WIS Station 67<br />
12 Figure 8. Interior Wind Rose, 2004 Orleans Data<br />
13 Figure 9. Tide Records, <strong>Chatham</strong> <strong>Harbor</strong> <strong>and</strong> Meetinghouse<br />
Pond<br />
15 Figure 10. Shoreline Processes<br />
List of Maps<br />
1. <strong>Pleasant</strong> <strong>Bay</strong> Regional Context<br />
2. Shoreline Change (series of four maps: North, West, Mid,<br />
South)<br />
3. Sediment Movement (series of five maps: <strong>Bay</strong>wide, North,<br />
West, Mid, South)<br />
4. Docks <strong>and</strong> Piers<br />
5. Shoreline Structures (series of four maps: North, West, Mid,<br />
South)<br />
6. Historic Hurricane Paths<br />
7. FEMA Flood Zones<br />
8. Public Access Points<br />
9. Surficial Geology<br />
10. <strong>Coastal</strong> Wetl<strong>and</strong> <strong>Resource</strong>s (series of four maps: North, West,<br />
Mid, South)<br />
11. Areas of Critical Marine Habitat<br />
12. Eelgrass Coverage<br />
13. Fish <strong>and</strong> Wildlife<br />
14. Rare Species Habitat<br />
15. Shellfish Suitability Areas<br />
16. HESP Priority <strong>and</strong> Estimated Habitat<br />
17. Bathymetry Data for Navigational Channels (series of nine<br />
maps: <strong>Bay</strong> wide data coverage, Meetinghouse Pond, Arey’s<br />
Pond, Paw Wah Pond, Quanset Pond, Round Cove, Crows<br />
Pond, Bassing <strong>Harbor</strong>, Ministers Point)<br />
18. Historic Navigation Channels, Areas of Maintenance Dredging<br />
<strong>and</strong> Possible Area of Shoaling<br />
i<br />
<strong>Pleasant</strong> <strong>Bay</strong> Alliance 2011
<strong>Coastal</strong> <strong>Resource</strong> <strong>Guide</strong> for <strong>Pleasant</strong> <strong>Bay</strong> <strong>and</strong> <strong>Chatham</strong> <strong>Harbor</strong><br />
Glossary of Terms<br />
Accretion: The process by which material is added to a<br />
l<strong>and</strong>mass, such as a beach.<br />
Aeolian transport: Material moved by the wind.<br />
Anadromous: Migrating from salt water to spawn in fresh<br />
water.<br />
Area of Critical Environmental Concern (ACEC): A place in<br />
Massachusetts that receives special recognition because of the<br />
quality, uniqueness, <strong>and</strong> significance of its natural <strong>and</strong> cultural<br />
resources.<br />
Bathymetry: The measurement of water depths, the underwater<br />
topography.<br />
Beach: A gently sloping zone of unconsolidated material,<br />
typically with a slightly concave profile, extending l<strong>and</strong>ward from<br />
the low-water line to the place where there is a definite change<br />
in material or physiographic form (such as a cliff) or to the line of<br />
permanent vegetation (usually the effective limit of the highest<br />
storm waves).<br />
Beach nourishment (Beach replenishment): The addition of<br />
material to a beach or similar area to offsets erosion.<br />
Benthic: Pertaining to the seafloor.<br />
Benthos: Animals that live on the seafloor.<br />
Biogeography: The study of the geographic distribution of<br />
organisms.<br />
Bulkhead: A retaining wall that has earth on one side, <strong>and</strong> is<br />
partially protected against waves or tidal action along the other.<br />
Cross shore sediment transport: The movement of sediment<br />
perpendicular to the shoreline in either direction through a<br />
combination of winds, waves <strong>and</strong> tides.<br />
CZM: <strong>Coastal</strong> Zone Management is a state agency whose<br />
mission is to balance the impacts of human activity with the<br />
protection of coastal <strong>and</strong> marine resources.<br />
(http://www.mass.gov/czm/)<br />
ESI: Environmental Sensitivity Index provides a summary of<br />
coastal resources that may be at risk.<br />
Estuary: A partly enclosed coastal body of water with a free<br />
connection to the open sea where fresh water <strong>and</strong> salt water<br />
mix.<br />
Estuarine: Having to do with an estuary.<br />
Fetch: The distance that a given wind blows over a body of<br />
water without interuption.<br />
Flood <strong>and</strong> ebb shoal: A shoal formed <strong>and</strong> or maintained by<br />
flood- or ebb-tidal currents.<br />
Gabions: Wire cages filled with stones or other materials <strong>and</strong><br />
stacked vertically or at an angle to protect objects or structures<br />
behind them.<br />
Geomorphic: Of or resembling the earth or its shape or surface<br />
configuration.<br />
Geomorphology: The scientific study of l<strong>and</strong>forms <strong>and</strong> the<br />
processes that shape them.<br />
Geospatial: Of or relating to the relative position of things on<br />
the earth’s surface.<br />
Glaciation: The formation, movement, <strong>and</strong> recession of glaciers<br />
(moving ice sheets).<br />
Groundwater: Water that is located beneath the surface in soil<br />
pore spaces <strong>and</strong> in the fractures of rocks.<br />
Hindcast: The process of using data <strong>and</strong> information (e.g. wind)<br />
from the past to estimate non-measured, past conditions (e.g.<br />
waves) using numerical models.<br />
Hydrodynamics: The movement of fluids; the branch of science<br />
that deals with the dynamics of fluids in motion.<br />
Intertidal: The intertidal zone is the area of the coast that lies<br />
between the highest normal high tide <strong>and</strong> the lowest normal low<br />
tide.<br />
LIDAR (Light Detection And Ranging): A remote sensing<br />
technology that uses laser scanning to collect height or elevation<br />
data.<br />
Littoral: 1) Of or relating to the coastal area of a lake, sea, or<br />
ocean; 2) Of or relating to the coastal area (zone) between the<br />
limits of high <strong>and</strong> low tides.<br />
Littoral cell: A section of shoreline where longshore sediment<br />
transport occurs without interruption during non-storm<br />
conditions.<br />
Littoral drift: See littoral transport.<br />
Littoral transport: The movement of sediment in the littoral<br />
zone due to the action of wave derived currents.<br />
Littoral processes: The interaction of winds, waves, currents,<br />
tides, sediments, <strong>and</strong> other phenomena in the littoral zone.<br />
Longshore current: The flow of water roughly parallel to the<br />
shoreline due to the action of wind, waves <strong>and</strong> currents.<br />
ii<br />
<strong>Pleasant</strong> <strong>Bay</strong> Alliance 2011
<strong>Coastal</strong> <strong>Resource</strong> <strong>Guide</strong> for <strong>Pleasant</strong> <strong>Bay</strong> <strong>and</strong> <strong>Chatham</strong> <strong>Harbor</strong><br />
Longshore sediment transport: The movement of sediment<br />
roughly parallel to the shoreline due to the action of winds,<br />
waves <strong>and</strong> currents.<br />
Marcoalgae: Large aquatic photosynthetic plants that can be<br />
seen without the aid of a microscope.<br />
MEP (The Massachusetts Estuaries Project): A project to<br />
provide water quality, nutrient loading, hydrodynamic <strong>and</strong> other<br />
information for 89 estuaries in Southeastern Massachusetts.<br />
MHW (Mean High Water): A tidal datum. The average of all<br />
the high water heights observed over the National Tidal Datum<br />
Epoch.<br />
MLW (Mean Low Water): A tidal datum. The average of all<br />
the low water heights observed over the National Tidal Datum<br />
Epoch.<br />
MORIS (Massachusetts Ocean <strong>Resource</strong> Information<br />
System): an online mapping tool created by CZM <strong>and</strong> the<br />
Massachusetts Office of Geographic <strong>and</strong> Environmental<br />
Information (MassGIS).<br />
National Tidal Datum Epoch: The specific l9-year period<br />
adopted by the National Ocean Service as the official time<br />
segment over which tide observations are taken <strong>and</strong> reduced<br />
to obtain mean values (e.g., mean low water, etc.) for tidal<br />
datums. It is necessary for st<strong>and</strong>ardization because of periodic<br />
<strong>and</strong> apparent secular trends in sea level. The present National<br />
Tidal Datum Epoch is 1960 through 1978. It is reviewed<br />
annually for possible revision <strong>and</strong> must be actively considered<br />
for revision every 25 years.<br />
NHESP (The Natural Heritage & Endangered Species<br />
Program): Agency charged with the protection of the state’s<br />
wide range of native biological diversity. It is part of the<br />
Massachusetts Division of Fisheries <strong>and</strong> Wildlife <strong>and</strong> is one of<br />
the programs forming the Natural Heritage network.<br />
Nitrogen overloading: The introduction of more nitrogen into<br />
a system than can be naturally assimilated.<br />
NOAA (National Oceanic <strong>and</strong> Atmospheric Administration):<br />
A federal agency in the Department of Commerce<br />
that attempts to underst<strong>and</strong> <strong>and</strong> predict changes in Earth’s<br />
environment <strong>and</strong> conserve <strong>and</strong> manage coastal <strong>and</strong> marine<br />
resources to meet economic, social, <strong>and</strong> environmental needs.<br />
Outwash: Sediment deposited by streams flowing away from a<br />
melting glacier.<br />
Overwash: The process of ocean water carrying sediment<br />
over low-lying coastal areas typically during high energy events<br />
(storms).<br />
Rollover: Barrier beaches <strong>and</strong> dunes migrate inl<strong>and</strong> as sea level<br />
rises <strong>and</strong> storms erode the beach <strong>and</strong> wash the s<strong>and</strong> over the<br />
dune, depositing it on the middle <strong>and</strong> backside of the beach as<br />
overwash deposits. The wind-blown dunes then rebuild l<strong>and</strong>ward<br />
of their former position.<br />
Salt Pannes: Shallow depressions in coastal marshes that contain<br />
very high concentrations of salt. Pannes retain seawater for very<br />
short periods of time. When the seawater evaporates, the salts<br />
remain <strong>and</strong> accumulate over many tidal cycles.<br />
Shoal: Typically a long, narrow (linear) bar of s<strong>and</strong> or gravel, also<br />
‘s<strong>and</strong> bar’, ‘gravel bar’, ‘bedform’.<br />
Sub-embayment: A smaller embayment within a larger embayed<br />
body of water.<br />
Subtidal: The area of the seafloor below the low tide line that is<br />
always covered by water.<br />
Subtidal shoals: A shoal that is always covered by water.<br />
Surficial geology: The characteristics of surficial deposits <strong>and</strong><br />
including soils.<br />
Tidal amplitude: The difference in elevation between low <strong>and</strong><br />
high tides at a particular point in a body of water.<br />
Tidal prism: The total volume of water that flows into an<br />
embayment, or inlet <strong>and</strong> out again with movement of the tide,<br />
excluding any fresh water flow.<br />
Tide range: The difference in height between consecutive high<br />
<strong>and</strong> low waters. The Mean tidal range is the difference in height<br />
between mean high water (MHW) <strong>and</strong> mean low water (MLW).<br />
TMDL: (Total Maximum Daily Load): A calculation of the<br />
maximum amount of a pollutant that a water body can receive<br />
<strong>and</strong> still safely meet water quality st<strong>and</strong>ards.<br />
USGS (United States Geological Survey http://www.usgs.<br />
gov/): A federal agency in the Department of Interior that<br />
provides impartial information on: the health of ecosystems <strong>and</strong><br />
environments; natural hazards; natural resources; the impacts of<br />
climate <strong>and</strong> l<strong>and</strong>-use change; <strong>and</strong> core science systems in order to<br />
provide timely, relevant, <strong>and</strong> useable information.<br />
Washover fans: A thin, fan-shaped deposit of sediment<br />
emplaced during an overwash event, typically a high-energy event<br />
such as a storm.<br />
WIS (Wave Information Studies): the U.S. Army Corps of<br />
Engineers produces wave climate information for U.S. coastal<br />
waters. WIS information is generated by numerical simulation of<br />
past wind <strong>and</strong> wave conditions, a process called hindcasting.<br />
iii<br />
Revetments: A sloped structure consisting of masonry, stone,<br />
s<strong>and</strong>bags, etc. constructed to protect objects or structures<br />
behind it.<br />
<strong>Pleasant</strong> <strong>Bay</strong> Alliance 2011
<strong>Coastal</strong> <strong>Resource</strong> <strong>Guide</strong> for <strong>Pleasant</strong> <strong>Bay</strong> <strong>and</strong> <strong>Chatham</strong> <strong>Harbor</strong><br />
Table of Contents<br />
Acknowledgements ______________________________<br />
List of Tables, Figures <strong>and</strong> Maps ___________________<br />
Glossary of Terms ________________________________<br />
Section 1. Introduction ___________________________<br />
1.1 Purpose Statement<br />
1.2 Study Area<br />
1.3 Organization of the <strong>Guide</strong><br />
Section 2. Barrier Beach <strong>and</strong> Inlet Dynamics ________<br />
2.1 Purpose<br />
2.2 Background<br />
2.3 Key Studies: Methodologies <strong>and</strong> Findings<br />
2.3.1 Barrier Beach <strong>and</strong> Inlet Migration<br />
2.3.2 Tide Gage Monitoring <strong>and</strong> Analysis<br />
2.3.3 Light Detection <strong>and</strong> Ranging (LIDAR)<br />
2.3.4 Inner Shoreline Change Rates<br />
2.3.5 Digital Database of Aerial Imagery<br />
Section 3. Wave <strong>and</strong> Tidal Conditions ______________<br />
3.1 Purpose<br />
3.2 Methodology-Outer Wave Climate<br />
3.2.1 Findings-Outer Wave Climate<br />
3.3 Methodology-Inner Wave Climate<br />
3.3.1 Findings-Inner Wave Climate<br />
3.4 Tide Cycle in <strong>Pleasant</strong> <strong>Bay</strong> <strong>and</strong> <strong>Chatham</strong> <strong>Harbor</strong><br />
Section 4. Sediment Transport _____________________<br />
4.1 Purpose<br />
4.2 Methodology-Sediment Transport<br />
4.3 Findings: Sediment Transport Types in<br />
<strong>Pleasant</strong> <strong>Bay</strong> <strong>and</strong> <strong>Chatham</strong> <strong>Harbor</strong><br />
4.3.1 Tidally Induced Transport<br />
4.3.2 Longshore Sediment Transport<br />
4.3.3 <strong>Coastal</strong> Bank <strong>and</strong> Dune Erosion<br />
4.3.4 Barrier Beach Overwash<br />
4.3.5 Cross-Shore Sediment Transport<br />
4.3.6 Aeolian Transport<br />
i<br />
i<br />
ii<br />
1<br />
2<br />
10<br />
14<br />
Section 5. <strong>Coastal</strong> Structures _________________<br />
5.1 Purpose<br />
5.2 Methodology<br />
5.3 <strong>Coastal</strong> Structures<br />
5.3.1 Shoreline Protection Structures<br />
5.3.2 Piers <strong>and</strong> Docks<br />
Section 6. <strong>Coastal</strong> Vulnerability _______________<br />
6.1 Purpose<br />
6.2 <strong>Coastal</strong> Vulnerability<br />
6.2.1 <strong>Coastal</strong> Flooding<br />
6.2.2 Shoreline Change from <strong>Coastal</strong> Erosion<br />
<strong>and</strong> Sea Level Rise<br />
Section 7. Natural <strong>Resource</strong>s _________________<br />
7.1 Purpose<br />
7.2 Methodology<br />
7.3 Surficial Geology<br />
7.4 <strong>Coastal</strong> Wetl<strong>and</strong>s <strong>Resource</strong>s<br />
7.4.1 Beaches, Dunes <strong>and</strong> <strong>Coastal</strong> Banks<br />
7.4.2 Marine <strong>and</strong> Estuarine Wetl<strong>and</strong>s<br />
7.4.3 Freshwater Wetl<strong>and</strong>s<br />
7.5 Fish <strong>and</strong> Wildlife<br />
7.5.1 Birds<br />
7.5.2 Seal Haul-out Sites<br />
7.5.3 Anadramous Fish Runs<br />
7.5.4 Shellfish <strong>and</strong> Horseshoe Crabs<br />
7.5.5 Rare Species <strong>and</strong> Priority Natural<br />
Community Types<br />
7.6 Water Quality<br />
Section 8. Bathymetry <strong>and</strong> Navigation ________<br />
8.1 Purpose<br />
8.2 Methodology<br />
8.3 Overview of the Channel System<br />
8.4 Boating<br />
8.5 Historical Channel Depths<br />
8.6 Existing Bathymetric Conditions<br />
8.7 Shoal Migration Patterns<br />
Sources _____________________________________ 36<br />
18<br />
21<br />
23<br />
32<br />
Maps _______________________________________ 38<br />
iv<br />
<strong>Pleasant</strong> <strong>Bay</strong> Alliance 2011
<strong>Coastal</strong> <strong>Resource</strong> <strong>Guide</strong> for <strong>Pleasant</strong> <strong>Bay</strong> <strong>and</strong> <strong>Chatham</strong> <strong>Harbor</strong><br />
Section 1<br />
Introduction<br />
1<br />
1.1 Purpose Statement<br />
<strong>Pleasant</strong> <strong>Bay</strong> is an exceptionally beautiful <strong>and</strong> environmentally<br />
significant estuarine system located on the eastern shore of<br />
Cape Cod in the Towns of <strong>Chatham</strong>, Orleans, Harwich, <strong>and</strong><br />
Brewster. The <strong>Pleasant</strong> <strong>Bay</strong> system is also renowned for the diverse<br />
recreational activities it supports, including shellfishing, sailing,<br />
power boating, kayaking, wind surfing <strong>and</strong> bird watching. The<br />
area’s significance as an environmental <strong>and</strong> cultural resource is<br />
evidenced by its designation as an Area of Critical Environmental<br />
Concern (ACEC) in 1987.<br />
The <strong>Pleasant</strong> <strong>Bay</strong> system is a collection of embayments, tidal rivers<br />
<strong>and</strong> salt ponds that currently exchange water with the Atlantic<br />
Ocean through two inlets in the Nauset Barrier Beach system. The<br />
barrier beach <strong>and</strong> inlet system follows a quasi-cyclical pattern of<br />
inlet formation <strong>and</strong> migration, which influences the volume <strong>and</strong><br />
rate of tidal exchange throughout the system. The configuration of<br />
the barrier beach <strong>and</strong> inlets greatly influences resource conditions<br />
within <strong>Pleasant</strong> <strong>Bay</strong> <strong>and</strong> adjacent <strong>Chatham</strong> <strong>Harbor</strong>.<br />
The dramatic changes in the Nauset barrier system observed<br />
over the past two decades, following the formation of inlets<br />
in 1987 <strong>and</strong> 2007, have included measurable changes in tide<br />
range <strong>and</strong> volume, sediment movement <strong>and</strong> shoreline erosion in<br />
both <strong>Pleasant</strong> <strong>Bay</strong> <strong>and</strong> <strong>Chatham</strong> <strong>Harbor</strong>. While these conditions<br />
are continuing to evolve, they have brought into sharper focus<br />
a multitude of coastal resource management issues. These<br />
management issues include protection of public <strong>and</strong> private<br />
property <strong>and</strong> infrastructure from erosion, protection of public<br />
access points, impacts to navigation, <strong>and</strong> impacts to fisheries,<br />
wetl<strong>and</strong>s <strong>and</strong> other coastal resources.<br />
The <strong>Coastal</strong> <strong>Resource</strong> <strong>Guide</strong> for <strong>Pleasant</strong> <strong>Bay</strong>/<strong>Chatham</strong> <strong>Harbor</strong> is<br />
intended to provide a source of objective, scientific information<br />
regarding the status of coastal resources in the <strong>Pleasant</strong> <strong>Bay</strong> <strong>and</strong><br />
<strong>Chatham</strong> <strong>Harbor</strong> system, <strong>and</strong> the dynamic forces <strong>and</strong> trends<br />
affecting resource conditions. The guide draws from a number of<br />
recent technical studies sponsored by the <strong>Pleasant</strong> <strong>Bay</strong> Alliance,<br />
as well as existing regional <strong>and</strong> state resources, to describe trends<br />
in barrier beach migration, tidal dynamics, flushing, water quality,<br />
<strong>and</strong> related processes.<br />
In providing this information, the guide seeks to present a<br />
comprehensive <strong>and</strong> long-term perspective on past, current <strong>and</strong><br />
likely future resource conditions in <strong>Pleasant</strong> <strong>Bay</strong> <strong>and</strong> <strong>Chatham</strong><br />
<strong>Harbor</strong>. The guide is intended as a resource to Conservation<br />
Commissions, planners, resource managers, property owners <strong>and</strong><br />
interested citizens. The guide provides the technical underpinnings<br />
for development of management recommendations <strong>and</strong> best<br />
practices for coastal erosion protection, beach nourishment, <strong>and</strong><br />
dredging, <strong>and</strong> for long-term planning to protect coastal resources<br />
<strong>and</strong> minimize coastal hazards.<br />
1.2 Study Area<br />
The study area for the guide includes the entire <strong>Pleasant</strong> <strong>Bay</strong><br />
ACEC <strong>and</strong> all of <strong>Chatham</strong> <strong>Harbor</strong> southward to the inlet formed in<br />
1987. Marine waterways within the study area include <strong>Chatham</strong><br />
<strong>Harbor</strong>, <strong>Pleasant</strong> <strong>Bay</strong> <strong>and</strong> Little <strong>Pleasant</strong> <strong>Bay</strong>, numerous salt<br />
ponds <strong>and</strong> coves (Meetinghouse Pond, Arey’s Pond, Pah Wah<br />
Pond, Kescayogansett Pond, Quanset Pond, Crow’s Pond, Round<br />
Cove, Ryder’s Cove <strong>and</strong> Bassing <strong>Harbor</strong>) <strong>and</strong> three tidal rivers<br />
(The River, Namequoit River, <strong>and</strong> Muddy Creek.) The ACEC also<br />
includes eleven freshwater ponds <strong>and</strong> lakes that have a perennial<br />
hydrological connection to <strong>Pleasant</strong> <strong>Bay</strong>. The study area, including<br />
the <strong>Pleasant</strong> <strong>Bay</strong> ACEC <strong>and</strong> watershed boundaries, is shown on<br />
Map 1.<br />
1.3 Organization of the <strong>Guide</strong><br />
The guide is intended to be a map-based resource to provide a<br />
spatial representation of data <strong>and</strong> information. Accordingly, each<br />
section contains a brief description of current resource conditions<br />
<strong>and</strong> trends, citing relevant research <strong>and</strong> background sources. Each<br />
section also contains references to GIS maps, compiled at the<br />
end of this document, which provide a visualization of resources,<br />
conditions <strong>and</strong> trends.<br />
In addition to this Introduction, the guide contains the following<br />
sections:<br />
Section 2. Barrier Beach <strong>and</strong> Inlet Dynamics<br />
Section 3. Wave <strong>and</strong> Tidal Conditions<br />
Section 4: Sediment Transport<br />
Section 5. <strong>Coastal</strong> Structures<br />
Section 6. <strong>Coastal</strong> Vulnerability<br />
Section 7. Natural <strong>Resource</strong>s<br />
Section 8. Bathymetry <strong>and</strong> Navigation<br />
A glossary of terms is provided at the beginning of the guide to<br />
assist readers who may be unfamiliar with some of the terms <strong>and</strong><br />
acronyms used.<br />
The guide <strong>and</strong> a complete set of maps have<br />
been provided to each Alliance community<br />
<strong>and</strong> to the Cape Cod Commission. However,<br />
due to the size <strong>and</strong> number of maps, it was<br />
not feasible to reproduce the entire guide for<br />
broad distribution. The guide <strong>and</strong> all maps<br />
may be viewed <strong>and</strong> downloaded from the<br />
Alliance website:<br />
www.pleasantbay.org.<br />
<strong>Pleasant</strong> <strong>Bay</strong> Alliance 2011
<strong>Coastal</strong> <strong>Resource</strong> <strong>Guide</strong> for <strong>Pleasant</strong> <strong>Bay</strong> <strong>and</strong> <strong>Chatham</strong> <strong>Harbor</strong><br />
Section 2<br />
Barrier Beach <strong>and</strong> Inlet Dynamics<br />
2.1 Purpose<br />
The purpose of this section is to illustrate the nature of change in<br />
the configuration of the Nauset Barrier Beach <strong>and</strong> inlet system, <strong>and</strong><br />
the inner shoreline areas of <strong>Pleasant</strong> <strong>Bay</strong> <strong>and</strong> <strong>Chatham</strong> <strong>Harbor</strong>.<br />
2.2 Background<br />
Together, <strong>Pleasant</strong> <strong>Bay</strong> <strong>and</strong> <strong>Chatham</strong> <strong>Harbor</strong> encompass seventy<br />
miles of shoreline, including the backside of the Nauset barrier<br />
beach <strong>and</strong> twelve <strong>and</strong> a half miles around six isl<strong>and</strong>s in <strong>Pleasant</strong><br />
<strong>Bay</strong>. This expanse of shoreline includes distinct barrier beach <strong>and</strong><br />
inl<strong>and</strong>/estuarine shoreline types. The intensity of wave energy<br />
varies for different shoreline types, from the quieter enclosed<br />
shores of salt ponds to more exposed shores subject to waves<br />
generated over a longer distance.<br />
As described more fully in Section 7, the Nauset Barrier Beach<br />
separating <strong>Pleasant</strong> <strong>Bay</strong> <strong>and</strong> <strong>Chatham</strong> <strong>Harbor</strong> from the open<br />
Atlantic Ocean is itself part of a much larger system of beaches<br />
formed of sediments eroded by wave action from the glacial<br />
deposits of outer Cape Cod <strong>and</strong> carried southward by littoral<br />
drift (Giese, 1978). Relative sea level was about 15-20 feet lower<br />
some 5,000 years ago than it is today. As sea level gradually rose<br />
<strong>and</strong> the cliffs of Truro, Wellfleet, Eastham <strong>and</strong> Orleans retreated,<br />
some of the eroded sediment moved southward to Nauset Beach.<br />
Through time, Nauset Beach elongated <strong>and</strong> migrated westward as<br />
storm waves eroded beaches <strong>and</strong> dunes <strong>and</strong> storm overwash <strong>and</strong><br />
tides transported sediments into <strong>Pleasant</strong> <strong>Bay</strong>, causing the barrier<br />
to roll over itself (Howes et al, 2006).<br />
Section Highlights<br />
<strong>Pleasant</strong> <strong>Bay</strong> <strong>and</strong> <strong>Chatham</strong> <strong>Harbor</strong> encompass seventy<br />
miles of varied shoreline.<br />
The Nauset Barrier Beach <strong>and</strong> inlet system is a<br />
major influence on tide range <strong>and</strong> natural resource<br />
conditions in <strong>Pleasant</strong> <strong>Bay</strong>. Tide ranges increased half<br />
a foot following the formation of the 2007 inlet, <strong>and</strong><br />
continued to increase a tenth of a foot per year in the<br />
three years following.<br />
The barrier beach <strong>and</strong> inlet follows a 150-year cycle of<br />
inlet formation <strong>and</strong> migration. In accordance with this<br />
cycle, a single stable inlet could be in place in twenty<br />
years <strong>and</strong> begin a southward migration in thirty years,<br />
potentially ending up somewhere between Minister’s<br />
Point <strong>and</strong> <strong>Chatham</strong> Light in fifty years.<br />
The inner shoreline of <strong>Pleasant</strong> <strong>Bay</strong> is more stable<br />
than the outer beach shoreline. A comparison of<br />
rates of change from 1868-2005 along twenty-five<br />
miles of shoreline where both the High Water Line<br />
(HWL) <strong>and</strong> the marshline were delineated showed<br />
that approximately six miles of the HWL <strong>and</strong> fourteen<br />
miles of the marshline exhibited statistically significant<br />
shoreline change over this timeframe.<br />
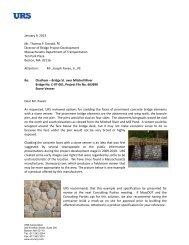
Nauset Beach is shown cluttered with clumps of peat deposited on<br />
the ocean-facing beach following a coastal storm. This photo provides<br />
further evidence of the coastal process known as “beach rollover.”<br />
The peat was initially formed in the marshes along the bayside of the<br />
barrier beach. As the ocean facing beach erodes <strong>and</strong> overwashes, the<br />
beach migrates l<strong>and</strong>ward (rolling over on itself) ultimately exposing the<br />
peat to the open ocean. Photo: Ted Keon<br />
<strong>Pleasant</strong> <strong>Bay</strong> Alliance 2011<br />
2.3 Key Studies: Methodologies <strong>and</strong> Findings<br />
A number of studies have compiled <strong>and</strong> analyzed current <strong>and</strong><br />
historical data regarding the Nauset Barrier Beach <strong>and</strong> inlet system.<br />
These studies have helped inform our underst<strong>and</strong>ing of the trends<br />
influencing barrier beach <strong>and</strong> inlet migration <strong>and</strong> their effects in<br />
<strong>Pleasant</strong> <strong>Bay</strong> <strong>and</strong> <strong>Chatham</strong> <strong>Harbor</strong>.<br />
2.3.1 Barrier Beach <strong>and</strong> Inlet Migration<br />
<strong>Pleasant</strong> <strong>Bay</strong> tides are controlled by an inlet system that generally<br />
follows an approximately 150-year cycle of inlet formation <strong>and</strong><br />
migration. Figure 1 depicts this cycle. As the barrier beach<br />
elongates it moves the inlet further south of the main basin of<br />
the <strong>Bay</strong>. The tidal exchange between ocean <strong>and</strong> <strong>Bay</strong> decreases as<br />
the barrier beach lengthens, creating hydraulic inefficiency. This<br />
inefficiency is overcome eventually by the formation of new<br />
northerly inlets, closer to <strong>Pleasant</strong> <strong>Bay</strong>. Over time the northernmost<br />
inlet becomes the dominant, <strong>and</strong> eventually the only inlet,<br />
as the barrier isl<strong>and</strong> forming the southern inlet erodes <strong>and</strong> moves<br />
inl<strong>and</strong>. The first phase of the cycle ends—<strong>and</strong> sets the stage for<br />
the following one —as the single inlet migrates southward far<br />
enough to recreate conditions of hydraulic inefficiency conducive<br />
to the formation of new inlets.<br />
2
<strong>Coastal</strong> <strong>Resource</strong> <strong>Guide</strong> for <strong>Pleasant</strong> <strong>Bay</strong> <strong>and</strong> <strong>Chatham</strong> <strong>Harbor</strong><br />
A full description of Nauset Barrier Beach <strong>and</strong> inlet formation<br />
<strong>and</strong> migration is found in a study commissioned by the <strong>Pleasant</strong><br />
<strong>Bay</strong> Alliance (Giese, 2009). The study builds upon earlier work<br />
(Giese,1978) <strong>and</strong> analyzes current aerial photography <strong>and</strong><br />
more than 150 years of historical data to assess the likely future<br />
movement of the outer beach <strong>and</strong> inlet. The data show that the<br />
formation of the inlet in 2007 is a continuation of the historical<br />
cycle, <strong>and</strong> that the cycle occurs in two distinct phases.<br />
Phase 1 is an inlet formation stage in which a new breaching<br />
event launches a period of multiple inlets <strong>and</strong> changes in tides <strong>and</strong><br />
tidal channels. The system is presently in Phase 1. It was initiated<br />
in 1987 with the formation of a new inlet east of <strong>Chatham</strong><br />
Light. Phase 2 is an inlet migration phase, in which a single stable<br />
inlet migrates southward. Under this scenario a single stable inlet<br />
could be in place in twenty years <strong>and</strong> begin a southward migration<br />
in thirty years, potentially ending up somewhere between<br />
Minister’s Point <strong>and</strong> <strong>Chatham</strong> Light in fifty years (Figure 1).<br />
2.3.2 Tide Gage Monitoring <strong>and</strong> Analysis<br />
From 2005 through 2010, tide gage data was collected from<br />
Meetinghouse Pond located at the headwaters of the <strong>Pleasant</strong><br />
<strong>Bay</strong> system in Orleans by Graham Giese (Provincetown Center for<br />
<strong>Coastal</strong> Studies) <strong>and</strong> Kelly Medeiros (Cape Cod National Seashore).<br />
The tide gage was deployed in the spring of 2005, 2006 <strong>and</strong> 2007,<br />
to allow the collection of data during at least one full lunar cycle<br />
each year. However, because of the breaching of Nauset Beach<br />
in April 2007, followed by formation of a new tidal inlet, the tide<br />
gage was left in place after the 2007 deployment until commercial<br />
marina reconstruction required its removal in December 2010. The<br />
tide gage was redeployed in April 2011 at a nearby location.<br />
The purpose of collecting the tide gage data was to monitor<br />
differences between the tides of <strong>Pleasant</strong> <strong>Bay</strong> <strong>and</strong> those of the<br />
open Atlantic Ocean outside of the <strong>Bay</strong>. Initially the monitoring was<br />
undertaken in an attempt to anticipate inlet formation. Changes<br />
in tide range <strong>and</strong> phase (see Section 3), as well as changes in<br />
tide distortion, can give valuable information about <strong>Pleasant</strong> <strong>Bay</strong><br />
hydrodynamics <strong>and</strong>, in so doing, give indications of conditions<br />
3<br />
Figure 1. Three images show successive morphological changes consistent with the initiation of a future wave-dominated inlet migration phase<br />
of the system’s development. In each, the barrier beach north of the inlet has become increasingly well developed, producing (a half-century<br />
following the 2007 breach) a well developed re-curved spit <strong>and</strong> tidal inlet in the general location of today’s Tern Isl<strong>and</strong> (Source: Giese, 2009).<br />
<strong>Pleasant</strong> <strong>Bay</strong> Alliance 2011
<strong>Coastal</strong> <strong>Resource</strong> <strong>Guide</strong> for <strong>Pleasant</strong> <strong>Bay</strong> <strong>and</strong> <strong>Chatham</strong> <strong>Harbor</strong><br />
Figure 2 shows projected changes in the Nauset Barrier Beach <strong>and</strong> Inlet System. (Source: Giese, 2009; Mark Adams)<br />
that could lead to changes in the barrier beach inlet configuration<br />
(Figure 2).<br />
An abrupt increase in tidal range followed the formation of a<br />
new tidal inlet in 2007 (Figure 3). After this inlet formed, the<br />
gage was maintained in order to record the expected ensuing<br />
tidal changes. They show that not only did tide range increase<br />
approximately half a foot directly following formation of the 2007<br />
inlet, but it continued to increase at an average rate of about a<br />
tenth of a foot per year during the following three years. These<br />
changes indicate increased flushing of the <strong>Bay</strong> resulting from<br />
improving tidal connections with the ocean.<br />
<strong>Pleasant</strong> <strong>Bay</strong> Alliance 2011<br />
2.3.3 Light Detection <strong>and</strong> Ranging (LIDAR)<br />
Additional measurements of the Nauset barrier shoreline have been<br />
collected through aerial imagery <strong>and</strong> a technology known as Light<br />
Detection <strong>and</strong> Ranging (LIDAR).<br />
LIDAR is an optical remote sensing technology that uses lasers to<br />
detect the distance to an object or surface. LIDAR measurements<br />
taken in the vicinity of <strong>Pleasant</strong> <strong>Bay</strong> appear like aerial photographs,<br />
but also contain detailed elevation data on the depth or height of<br />
l<strong>and</strong>forms.<br />
4
<strong>Coastal</strong> <strong>Resource</strong> <strong>Guide</strong> for <strong>Pleasant</strong> <strong>Bay</strong> <strong>and</strong> <strong>Chatham</strong> <strong>Harbor</strong><br />
Figure 3 illustrates the increase in tide range (difference between high tide <strong>and</strong> low tide) following the formation of a second inlet in 2007<br />
(indicated by the green vertical line). Mean monthly low tides (bottom-most diamond shapes) remain fairly stable following the 2nd inlet<br />
formation, <strong>and</strong> mean monthly high tides (top-most diamond shapes) increased markedly, due to the higher volume of water entering the two-inlet<br />
system. As result, tide range increased approximately a half-foot in the first few months following the 2007 inlet formation, <strong>and</strong> it continued<br />
to increase at an average rate of about a tenth of a foot per year during the following 3 years. Data were collected from a tide gage installed at<br />
Meetinghouse Pond in Orleans.<br />
LIDAR data for <strong>Pleasant</strong> <strong>Bay</strong> vary in coverage <strong>and</strong> quality. Typically<br />
LIDAR data sets have high resolution but historically have only<br />
covered the barrier beach systems of <strong>Pleasant</strong> <strong>Bay</strong> (Figure 4). LIDAR 1<br />
is a powerful tool to provide the elevation or height of l<strong>and</strong>forms<br />
such as dunes or shoals <strong>and</strong> determine how elevations change over<br />
time. A series of change-over-time maps is shown in Figure 5. This<br />
example is a broad scale analysis of a large area, <strong>and</strong> is not meant<br />
for viewing individual parcels. A comparison of Figures 4 <strong>and</strong> 5<br />
serves to illustrate the care that must be taken in interpreting these<br />
large, dense data sets. For example, an uninformed analysis might<br />
conclude that the shallow water bottom just offshore of Nauset<br />
Beach shoaled between 1998 <strong>and</strong> 2000, but deepened between<br />
2000 <strong>and</strong> 2007. In fact, of course, each data set represents only the<br />
conditions that existed at the time of the survey; they provide no<br />
information concerning the changes that occurred between surveys.<br />
2.3.4 Inner Shoreline Change Rates<br />
Recognizing that little scientific study or measurement had<br />
been done to assess change in the inner shoreline, the Alliance<br />
commissioned two research projects focused on the inner<br />
shoreline. The first project compiled <strong>and</strong> digitized decades of aerial<br />
photography encompassing the inner shoreline available from<br />
disparate sources. A second study analyzed the aerial imagery to<br />
measure the extent of change in the inner shoreline.<br />
The rates of shoreline change in this resource guide are taken from<br />
a study commissioned by the <strong>Pleasant</strong> <strong>Bay</strong> Alliance (Borrelli, 2009).<br />
The study looked at shoreline change in <strong>Pleasant</strong> <strong>Bay</strong> using two<br />
different shoreline indicators. Shoreline change from 1868 to 2005<br />
using the High Water Line (HWL) shoreline indicator was compared<br />
to shoreline change from 1938 to 2005 using the basinward edge<br />
of marsh vegetation, or ‘marshline’ shoreline indicator. A detailed<br />
5<br />
1 Examples of LIDAR being used within <strong>Pleasant</strong> <strong>Bay</strong> include: bathymetry data utilized in the development of a <strong>Pleasant</strong> <strong>Bay</strong> hydrodynamic model for post-breach<br />
analysis, elevations serving as monitoring data for the NPS, <strong>and</strong> research into developing <strong>and</strong> testing remote sensing equipment <strong>and</strong> processing <strong>and</strong> analysis techniques.<br />
Some potential additional applications of LIDAR data within <strong>Pleasant</strong> <strong>Bay</strong> include: analyzing a time-series of beach <strong>and</strong> near shore conditions for geomorphic change<br />
studies, habitat mapping, ecological monitoring, change detection, <strong>and</strong> event assessment. Available seamless elevation data include: 10x10 meter – produced by<br />
USGS NED, 5x5 meter – produced by MassGIS, <strong>and</strong> ≤ 3x3 meter LIDAR (Light Detection And Ranging) – produced by individual <strong>and</strong> joint studies by NASA, NOAA, NPS,<br />
USACE, <strong>and</strong> USGS. A logistical limitation is that LIDAR is data dense <strong>and</strong> requires a large amount of computing resources. Additionally, different LIDAR systems utilize<br />
distinct laser wavelengths in order to vary penetration through water <strong>and</strong> saturated fine grained sediments, this can affect elevation readings in certain sediment types.<br />
Differing processing algorithms (Bare-earth, Top of Canopy, Average, etc) may be utilized, <strong>and</strong> vegetation cover can affect laser penetration to the ground. Each project<br />
can have systematic inaccuracies which become amplified when comparing between datasets. LIDAR surveys are a snapshot in time, <strong>and</strong> may not be reflective of typical<br />
elevations <strong>and</strong> can be greatly influenced by individual events (think of the difference between a summer vs. winter beach, or right after a storm).<br />
<strong>Pleasant</strong> <strong>Bay</strong> Alliance 2011
<strong>Coastal</strong> <strong>Resource</strong> <strong>Guide</strong> for <strong>Pleasant</strong> <strong>Bay</strong> <strong>and</strong> <strong>Chatham</strong> <strong>Harbor</strong><br />
discussion of both indicators <strong>and</strong> documented changes is found in<br />
the study report.<br />
Shoreline change from 1868 to 2005 used a combination of<br />
Topographic sheets (T-Sheets) from the National Oceanic <strong>and</strong><br />
Atmospheric Administration (NOAA) <strong>and</strong> hardcopy <strong>and</strong> digital<br />
vertical aerial photography from various sources including the<br />
Town of <strong>Chatham</strong>, Cape Cod National Seashore (CCNS) <strong>and</strong> the<br />
Massachusetts Geographic Information Systems Website (www.<br />
mass.gov/mgis).<br />
Shoreline change was calculated every 65 feet for the entire<br />
shoreline of <strong>Pleasant</strong> <strong>Bay</strong>. Starting from the open ocean shoreline<br />
south of Nauset barrier beach in Orleans, along the entire<br />
embayment shoreline, to the northernmost point of South Beach<br />
near the 1987 inlet. The 2005 shoreline was 62 miles long.<br />
Rates of change along 25 miles of shoreline where both the<br />
HWL <strong>and</strong> the marshline were delineated were documented<br />
<strong>and</strong> compared to one another. Less than 6.1 miles of the HWL<br />
exhibited statistically significant shoreline change as compared to<br />
14 miles of the marshline for the same segments of the shoreline.<br />
Thus, 8 miles of shoreline that saw no change using the HWL had,<br />
in fact, experienced erosion of the marshline, in some places up to<br />
55 feet. Shoreline change is depicted on the Map 2 series.<br />
Changes in marsh vegetation below the HWL have implications<br />
for sediment transport, storm damage prevention <strong>and</strong> flood<br />
control that would not be otherwise quantifiable using most other<br />
shoreline indicators. Furthermore, application of this method for<br />
tracking marsh change also has potential usefulness for water<br />
quality, predator-prey relationships, ecosystem health <strong>and</strong> other<br />
science <strong>and</strong>/or management issues. The marshline allows the<br />
investigator to quantitatively assess changes in salt marsh habitat<br />
related to surface area, fringing marsh thickness, shoreline<br />
orientation <strong>and</strong> marsh disappearance <strong>and</strong> appearance. This<br />
technique also has implications for inlet formation as inlets are less<br />
likely to form in places with extensive salt marsh.<br />
2.3.5 Digital Database of Aerial Imagery<br />
Historical aerial imagery is a useful tool that enables resource<br />
managers to track changes in a dynamic system over time (Table<br />
1). For example, Figure 6 shows successive aerial photographic<br />
depictions of the Nauset barrier beach <strong>and</strong> inlets over a period<br />
of five years, during which time the second inlet formed. A<br />
significant archive of aerial photography of <strong>Pleasant</strong> <strong>Bay</strong> <strong>and</strong><br />
<strong>Chatham</strong> <strong>Harbor</strong> has been compiled by the <strong>Pleasant</strong> <strong>Bay</strong> Alliance,<br />
beginning with photographs from 1938. The Alliance, in concert<br />
with the Towns of <strong>Chatham</strong> <strong>and</strong> Orleans, continues to commission<br />
regular aerial imaging of the entire system.<br />
Table 1. Breakdown of Digitized Aerial Photographs.<br />
Year No. of Photos Scale Scanned Resolution Source Total Size (MegaBytes) Color/B&W<br />
1938 15 1:24,000 1200 CCNS 1659 B&W<br />
1947 7 1:18,00 1200 CCNS 758 B&W<br />
1960 66 1:10,000 (approx) 1000 CCNS 6498 B&W<br />
1970 9(9) 1:20,000 (approx) 1200 (600) CCNS 967(723) Color(B&W)<br />
1978 10 1:24,000 1200 CCNS 1085 B&W<br />
1994-APR 12 1:5,000 N/A (1 meter) MassGIS 69 B&W<br />
1994-SEP 12 1:5,000 N/A (1 meter) MassGIS 26 Color<br />
2000 161 1:6,000 600 TOC 12994 Color<br />
2001 12 1:5,000 N/A (1/2 meter) MassGIS 115 Color<br />
2003 35 1:10,000 1200 CCNS 3256 Color<br />
2005 12 1:5,000 N/A (1/2 meter) MassGIS 115 Color<br />
2009 43 ---- 30 cm MassGIS 5 Mb/file, 215 total Color<br />
11 Coverages (10 yrs) 348 28.3GB<br />
CCNS = Cape Cod National Seashore, TOC = Town of <strong>Chatham</strong>, MassGIS = Massachusetts Geographic Information Systems website.<br />
*Not included in Borrelli report<br />
2 Most of the images were nine by nine inches; however the desktop scanner used was eight <strong>and</strong> one-half inches by fourteen inches. Therefore, careful attention was<br />
required during scanning to determine which edge(s) would, or would not be included in the scan<br />
6<br />
<strong>Pleasant</strong> <strong>Bay</strong> Alliance 2011
<strong>Coastal</strong> <strong>Resource</strong> <strong>Guide</strong> for <strong>Pleasant</strong> <strong>Bay</strong> <strong>and</strong> <strong>Chatham</strong> <strong>Harbor</strong><br />
7<br />
Figure 4<br />
<strong>Pleasant</strong> <strong>Bay</strong> Alliance 2011
<strong>Coastal</strong> <strong>Resource</strong> <strong>Guide</strong> for <strong>Pleasant</strong> <strong>Bay</strong> <strong>and</strong> <strong>Chatham</strong> <strong>Harbor</strong><br />
Figure 5 8<br />
<strong>Pleasant</strong> <strong>Bay</strong> Alliance 2011
<strong>Coastal</strong> <strong>Resource</strong> <strong>Guide</strong> for <strong>Pleasant</strong> <strong>Bay</strong> <strong>and</strong> <strong>Chatham</strong> <strong>Harbor</strong><br />
2006<br />
2007<br />
2008<br />
2009<br />
<strong>Chatham</strong> Inlet Development 2006-2010<br />
2010<br />
0 0.25 0.5 1 Miles<br />
Aerial Photography produced by James W. Sewall Company<br />
9<br />
Figure 6<br />
<strong>Pleasant</strong> <strong>Bay</strong> Alliance 2011
<strong>Coastal</strong> <strong>Resource</strong> <strong>Guide</strong> for <strong>Pleasant</strong> <strong>Bay</strong> <strong>and</strong> <strong>Chatham</strong> <strong>Harbor</strong><br />
Section 3<br />
Wave <strong>and</strong> Tidal Conditions<br />
3.1 Purpose<br />
The purpose of this section is to describe wave <strong>and</strong> tidal conditions<br />
that impact <strong>Pleasant</strong> <strong>Bay</strong> <strong>and</strong> <strong>Chatham</strong> <strong>Harbor</strong>. Wave conditions<br />
include the intensity of waves generated in the Atlantic Ocean that<br />
reach the barrier beach, as well as waves formed inside <strong>Pleasant</strong><br />
<strong>Bay</strong> <strong>and</strong> <strong>Chatham</strong> <strong>Harbor</strong>. The cycle of tides in <strong>Pleasant</strong> <strong>Bay</strong> <strong>and</strong><br />
<strong>Chatham</strong> <strong>Harbor</strong> is an important related physical process. Tides,<br />
along with wind <strong>and</strong> wave conditions, help to move sediment<br />
along the shoreline, as described in Section 4.<br />
3.2 Methodology - Outer Wave Climate<br />
Ocean waves reaching the outer barrier beach shoreline are<br />
influenced by meteorological conditions offshore in the Gulf of<br />
Maine <strong>and</strong> do not represent conditions in <strong>Pleasant</strong> <strong>Bay</strong>. However,<br />
underst<strong>and</strong>ing the outer ocean wave climate is important because<br />
it is among the dominant forces shaping the barrier beach.<br />
The direction <strong>and</strong> intensity of ocean wave energy can be depicted<br />
by a wave rose. A wave rose graphically summarizes wave height,<br />
frequency, <strong>and</strong> direction. The wave rose for this resource guide was<br />
derived from offshore Wave Information Studies (WIS) hindcast<br />
data. The wave rose in Figure 7 illustrates the percentage of waves<br />
that arrive from a given directional b<strong>and</strong> <strong>and</strong> the distribution of<br />
wave height within that direction b<strong>and</strong>.<br />
The WIS hindcast data provide a valuable source of long-term<br />
wave data, at dense spatial resolution <strong>and</strong> over a period of<br />
time not available from measurements. The WIS uses historical<br />
meteorological data to calculate hourly wave conditions, which<br />
are then verified against measurements from wave buoys. The<br />
resultant data set is comprised of twenty years (1980-1999) of<br />
wave information, including significant wave height, peak period,<br />
<strong>and</strong> direction once each hour.<br />
A relatively small change in wave direction could correlate to<br />
a major impact on storm damage for a portion of shoreline<br />
protected by headl<strong>and</strong>s, which can shelter neighboring beaches.<br />
This protection is highly sensitive to the direction from which the<br />
waves are coming. An open stretch of barrier beach (e.g., Nauset)<br />
is much less sensitive to small changes in the angle of wave attack.<br />
It should be noted that these roses are for an area greater than ten<br />
miles offshore of <strong>Pleasant</strong> <strong>Bay</strong> <strong>and</strong> do not take into consideration<br />
fine-scale geometry that can have a significant local impact on<br />
wind <strong>and</strong> waves. This data is presented to illustrate the general<br />
wind <strong>and</strong> wave patterns for the portion of the coast exposed to<br />
ocean waves.<br />
3.2.1 Findings - Outer Wave Climate<br />
WIS station 67 has a broad, but fairly consistent, wave direction<br />
from between 0 <strong>and</strong> 180 degrees (north-east-south) <strong>and</strong><br />
approximately 95% of the waves during this time had a height<br />
of less than two meters. The wave rose of the offshore WIS<br />
wave hindcast station shows the relatively weak westerly wave<br />
Section Highlights<br />
The outer coastline is dominated by waves that do<br />
not originate from local wind conditions, but instead<br />
are generated offshore in the Gulf of Maine. These<br />
offshore winds have limited influence on wave<br />
conditions inside <strong>Pleasant</strong> <strong>Bay</strong> <strong>and</strong> <strong>Chatham</strong> <strong>Harbor</strong>.<br />
Local <strong>and</strong> seasonally variable winds as well as<br />
bathymetry (water depth) <strong>and</strong> fetch (distance wind<br />
travels over water) affect wave conditions in the<br />
interior of the <strong>Bay</strong>. The summer is characterized by<br />
lower wind speed <strong>and</strong> a dominant wind direction<br />
from the southwest. Winter is characterized by<br />
prevailing northwest winds <strong>and</strong> higher wind speeds.<br />
Tides within <strong>Pleasant</strong> <strong>Bay</strong> <strong>and</strong> <strong>Chatham</strong> <strong>Harbor</strong><br />
are semi-diurnal (two tidal cycles per day) with an<br />
average range of approximately 6 feet in <strong>Chatham</strong><br />
<strong>Harbor</strong> <strong>and</strong> 4.5 feet at Meetinghouse Pond in<br />
Orleans at the very head of Little <strong>Pleasant</strong> <strong>Bay</strong>. These<br />
tides are produced by the open continental shelf<br />
(Gulf of Maine) tides which, as they rise <strong>and</strong> fall,<br />
cause seawater to flow into <strong>and</strong> out of the estuary<br />
through the tidal inlets that connect the two systems.<br />
conditions for the open ocean due to the shadowing effect of the<br />
Outer Cape. All stations show the trend of a higher quantity of<br />
waves from the south, but a larger significant wave height from<br />
the north. This indicates that over the course of a year seasonal<br />
(e.g. northeasterly) waves occur with similar frequency, but the<br />
overall impact may be larger as the higher wave heights tend<br />
to approach from the same direction. The wave data is from<br />
all months during the twenty-year period in order to depict an<br />
annual average wave condition free of seasonal trends. The wind<br />
rose for the same station <strong>and</strong> time period (also shown on Figure<br />
7) shows that most of the wind is traveling from west to east,<br />
the opposite of prevailing ocean wave conditions. This indicates<br />
that offshore waves are more heavily influenced by conditions in<br />
the Atlantic Ocean than nearby l<strong>and</strong>-derived winds. As such, the<br />
wave rose likely does not represent conditions within <strong>Pleasant</strong> <strong>Bay</strong>,<br />
but instead provides insight as to the energy impacting the outer<br />
coastlines of the barrier beaches.<br />
3.3 Methodology - Inner Wave Climate<br />
The waves within <strong>Pleasant</strong> <strong>Bay</strong> are influenced by the local<br />
wind regime. Estimating potential wave heights can be quite<br />
complicated <strong>and</strong> is very site specific, but generally is a function<br />
of wind velocity, fetch, <strong>and</strong> duration of the wind. Atlantic Ocean<br />
waves that may enter the system through inlets also may have<br />
some influence on the <strong>Bay</strong>’s inner wave climate. While the 10<br />
<strong>Pleasant</strong> <strong>Bay</strong> Alliance 2011
<strong>Coastal</strong> <strong>Resource</strong> <strong>Guide</strong> for <strong>Pleasant</strong> <strong>Bay</strong> <strong>and</strong> <strong>Chatham</strong> <strong>Harbor</strong><br />
11 Figure 7<br />
<strong>Pleasant</strong> <strong>Bay</strong> Alliance 2011
<strong>Coastal</strong> <strong>Resource</strong> <strong>Guide</strong> for <strong>Pleasant</strong> <strong>Bay</strong> <strong>and</strong> <strong>Chatham</strong> <strong>Harbor</strong><br />
Figure 8. Wind data collected from a site in Orleans by the Renewable Energy Research Laboratory, UMASS, displayed as wind roses using Lakes<br />
Environmental Software WRPLOT View <br />
previous section on outer wave climate dealt with the forces<br />
shaping the barrier beach, this section deals with waves generated<br />
within the estuarine system. As the offshore WIS stations are not<br />
suitable for depicting wind <strong>and</strong>/or waves within <strong>Pleasant</strong> <strong>Bay</strong>, an<br />
alternative station consisting solely of wind data was utilized. From<br />
2003 to 2005 data was collected to support a Wind Data Report<br />
for Orleans by the Renewable Energy Research Laboratory (RERL)<br />
at the University of Massachusetts-Amherst. This publicly available<br />
dataset was downloaded for the resource guide <strong>and</strong> the only full<br />
year (2004) was extracted in order not to bias the average with<br />
seasonal trends. It should be noted that the resultant data set<br />
is comprised of only one year of data, as opposed to the twenty<br />
years of WIS data, <strong>and</strong> therefore there is a much higher potential<br />
for long-term trends to be lost <strong>and</strong> for short-term perturbations<br />
in a cycle to skew the trend. The vane (wind direction) <strong>and</strong><br />
anemometer (wind speed) data used to generate the wind rose 12<br />
<strong>Pleasant</strong> <strong>Bay</strong> Alliance 2011
<strong>Coastal</strong> <strong>Resource</strong> <strong>Guide</strong> for <strong>Pleasant</strong> <strong>Bay</strong> <strong>and</strong> <strong>Chatham</strong> <strong>Harbor</strong><br />
were located on a UMass tower twenty meters off the ground,<br />
near Arey’s Pond in Orleans. The data have been filtered by RERL’s<br />
quality control software, filtered to hourly average, <strong>and</strong> entered<br />
into Lakes Environmental Software WRPLOT View which is<br />
designed to created wind rose plots for meteorological data.<br />
The direction <strong>and</strong> intensity of estuarine wind energy has been<br />
depicted by a wind rose (Figure 8). The wind rose summarizes<br />
wind speed, duration <strong>and</strong> direction. Additional detail is provided<br />
by providing three roses, one annual average, one just for May<br />
through October, <strong>and</strong> one just for November through April.<br />
3.3.1 Findings - Inner Wave Climate<br />
The Orleans station has a broad, but fairly consistent, annual<br />
wind direction from the northwest to the southwest. Annually,<br />
approximately 70% of the time winds are between four <strong>and</strong><br />
eleven knots. The summer is characterized by lower wind speed<br />
<strong>and</strong> a dominant wind direction from the southwest. The winter is<br />
characterized by a northwest dominant wind direction <strong>and</strong> higher<br />
wind speeds. Summer winds only exceed twelve knots 6.6% of<br />
the time, compared to 21.5% for winter winds. The southwest<br />
winds do not happen as often in the winter as they do in the<br />
summer, but when they occur in the winter they are frequently<br />
stronger.<br />
<strong>Pleasant</strong> <strong>Bay</strong> is a complex estuarine system. In addition to an<br />
irregular shoreline, it contains numerous isl<strong>and</strong>s <strong>and</strong> mobile<br />
shoals, all of which may block or redirect surface winds <strong>and</strong>/or the<br />
resultant waves. The inner wind roses are not a perfect proxy for<br />
inner wave climate, however they illustrate the seasonality of the<br />
wind, which drives wave generation within <strong>Pleasant</strong> <strong>Bay</strong>. A later<br />
section (4.3 - Longshore Sediment Transport) further discusses<br />
inner wave climate as it relates to sediment transport.<br />
3.4 Tidal Cycle in <strong>Pleasant</strong> <strong>Bay</strong> <strong>and</strong> <strong>Chatham</strong> <strong>Harbor</strong><br />
Tides within the <strong>Pleasant</strong> <strong>Bay</strong> <strong>and</strong> <strong>Chatham</strong> <strong>Harbor</strong> estuary are<br />
semi-diurnal (two tidal cycles per day) with an average range of<br />
somewhat less than six feet in <strong>Chatham</strong> <strong>Harbor</strong> <strong>and</strong> about four<br />
<strong>and</strong> one-half feet at Meetinghouse Pond in Orleans at the very<br />
head of Little <strong>Pleasant</strong> <strong>Bay</strong> (Figure 9). These tides are produced<br />
by the open continental shelf (Gulf of Maine) tides which, as they<br />
rise <strong>and</strong> fall, cause seawater to flow into <strong>and</strong> out of the estuary<br />
through the tidal inlets that connect the two systems.<br />
Passage of the tidal wave through the inlets <strong>and</strong> inner channels<br />
delays <strong>and</strong> distorts the estuary’s tides. While high tide at <strong>Chatham</strong><br />
<strong>Harbor</strong> occurs less than an hour following Boston high tide (Boston<br />
is the location of the region’s tidal reference station), <strong>Chatham</strong>’s<br />
low tide occurs more than an hour after Boston’s low. At<br />
Meetinghouse Pond the delay <strong>and</strong> distortion are greater. Highs <strong>and</strong><br />
lows occur about two <strong>and</strong> one-half <strong>and</strong> three <strong>and</strong> one-half hours,<br />
respectively, after those at Boston.<br />
reducing ranges <strong>and</strong> increasing phase lags (time delay between<br />
the Boston <strong>and</strong> local tides) over most of the 21 st Century.<br />
This discussion has concerned “astronomical” or “predicted” tides<br />
in the estuary, but the actual water level at any time <strong>and</strong> place<br />
may differ markedly from the predicted tides due to atmospheric<br />
conditions. A common example would be the effect of storm<br />
surges along the outer coast, but even greater anomalies can<br />
result from direct wind stress acting along the length of the<br />
system, either “setting-up” or “setting-down” the water level,<br />
especially in the ponds <strong>and</strong> narrows.<br />
<strong>Chatham</strong> <strong>Harbor</strong> tides are recorded (at the time of this writing) by<br />
the National Ocean Service (NOAA) at <strong>Chatham</strong>’s municipal fish<br />
pier (Aunt Lydia’s Cove). Both “real-time” <strong>and</strong> historic sea level<br />
data are available for this station on-line at http://tides<strong>and</strong>currents.<br />
noaa.gov/. In addition, the Cape Cod National Seashore (CCNS)<br />
presently operates a tide recorder at Meetinghouse Pond in<br />
Orleans. Tidal data for a single day from both stations are<br />
presented together in Figure 9.<br />
Elevation (feet - navd88)<br />
6<br />
5<br />
4<br />
3<br />
2<br />
1<br />
0<br />
-1<br />
-2<br />
-3<br />
-4<br />
28<br />
Tide Records:<br />
<strong>Chatham</strong> <strong>Harbor</strong> (red) <strong>and</strong> Meetinghouse Pond (blue)<br />
28.5 29 29.5 30<br />
October 2011<br />
Figure 9 shows changes in tide elevation over October 28–29, 2011 for<br />
<strong>Chatham</strong> <strong>Harbor</strong> (red) <strong>and</strong> Meetinghouse Pond (Orleans) at the head<br />
of Little <strong>Pleasant</strong> <strong>Bay</strong> (blue).<br />
13<br />
As discussed in Section 2, the inlets <strong>and</strong> channels within the<br />
estuary continually shift position <strong>and</strong> these changes produce<br />
corresponding changes in <strong>Pleasant</strong> <strong>Bay</strong> <strong>and</strong> <strong>Chatham</strong> <strong>Harbor</strong> tides.<br />
The present (2011) configuration is probably near-optimal with<br />
respect to tide range within the estuary, so we anticipate slowly<br />
<strong>Pleasant</strong> <strong>Bay</strong> Alliance 2011
<strong>Coastal</strong> <strong>Resource</strong> <strong>Guide</strong> for <strong>Pleasant</strong> <strong>Bay</strong> <strong>and</strong> <strong>Chatham</strong> <strong>Harbor</strong><br />
Section 4<br />
Sediment Transport<br />
4.1 Purpose<br />
The purpose of this section is to describe <strong>and</strong> illustrate the<br />
fundamental processes that influence sediment movement along<br />
the shoreline of <strong>Pleasant</strong> <strong>Bay</strong> <strong>and</strong> <strong>Chatham</strong> <strong>Harbor</strong>.<br />
4.2 Methodology - Sediment Transport<br />
The direction of sediment transport within the system was<br />
determined from a review of shoreline type, as well as extensive<br />
regional <strong>and</strong> local knowledge of factors that influence littoral<br />
processes (e.g., waves, tides, storm surge, wind, etc). Direction<br />
of sediment transport is only delineated in areas where sediment<br />
movement is significant, i.e., shorelines exhibiting active movement<br />
of nearshore sediments.<br />
Along most areas of the <strong>Pleasant</strong> <strong>Bay</strong> shoreline, tides <strong>and</strong> waves<br />
comprise the primary forces for reshaping the shoreline. The effect<br />
of these forces varies throughout the system, from the relatively<br />
straight, smooth outer shoreline, to inner estuarine areas where<br />
multiple isl<strong>and</strong>s break up the force of wind, waves <strong>and</strong> currents,<br />
resulting in an irregular coast. Beaches have formed due to<br />
long-term coastal erosion (the reworking of glacial <strong>and</strong> Holocene<br />
deposits). Additionally, large portions of shoreline (e.g. bayside<br />
of the northern barrier beach system) are fronted by marsh which<br />
dissipates wave energy by friction <strong>and</strong> drag, thereby reducing<br />
erosion further inl<strong>and</strong>. The natural variability in shoreline type<br />
influences how a particular shoreline stretch responds to the longterm<br />
effects of waves <strong>and</strong> tides, as well as the infrequent, shortterm<br />
influence of storm waves <strong>and</strong> surge.<br />
Based on the regional geomorphology <strong>and</strong> exposure of the<br />
shoreline to wave conditions (i.e., fetch), it was possible to assess<br />
the dominant coastal processes governing the various shoreline<br />
regions of <strong>Pleasant</strong> <strong>Bay</strong>. The Map 3 series depicting sediment<br />
movement provides information regarding the direction, but not<br />
the magnitude, of longshore sediment transport <strong>and</strong> fetch data<br />
for each 200 feet of shoreline within <strong>Pleasant</strong> <strong>Bay</strong>. As shown in<br />
the map legend, the fetch is classified at the following intervals:<br />
1/8, 1/4, 1/2, 1, 2, 5, <strong>and</strong> 10 miles. The lack of observable<br />
longshore sediment transport indicators in areas with fetch less<br />
than a half mile likely indicates that other coastal processes are<br />
more significant in these areas. Fetch is one parameter that<br />
affects potential wave height for any given section of coastline.<br />
As noted in Section 3, estimating potential wave heights can be<br />
quite complicated <strong>and</strong> is very site specific. With that in mind, wave<br />
height generally is a function of wind velocity, fetch, <strong>and</strong> duration<br />
of the wind. Furthermore, this function does not apply in shallow<br />
water where wave heights are limited due to forced wave breaking<br />
when the height exceeds approximately 0.6 to 0.8 times the water<br />
depth. 1<br />
Section Highlights<br />
Sediment transport along most of <strong>Pleasant</strong> <strong>Bay</strong> <strong>and</strong><br />
<strong>Chatham</strong> <strong>Harbor</strong> is predominantly characteristic of<br />
longshore transport (drift) or tidally induced transport.<br />
Proximity to inlets can increase susceptibility to tidally<br />
induced transport.<br />
Proximity to a new inlet may correlate to increased<br />
fetch <strong>and</strong> tidal flow.<br />
Longshore sediment transport is minimal in areas of<br />
less than half a mile fetch.<br />
Headl<strong>and</strong>s <strong>and</strong> inlets (including the 2007 inlet) affect<br />
the flow of sediment within the <strong>Pleasant</strong> <strong>Bay</strong> system.<br />
While the flow of sediment on the outer shoreline is<br />
consistently north to south, the direction of transport<br />
along the irregular interior shoreline of <strong>Pleasant</strong> <strong>Bay</strong><br />
varies depending on fetch distance <strong>and</strong> wave direction.<br />
4.3 Findings: Sediment Transport Processes in <strong>Pleasant</strong><br />
<strong>Bay</strong> <strong>and</strong> <strong>Chatham</strong> <strong>Harbor</strong><br />
Sediment transport in estuarine systems is more complex to<br />
map than open coast environments. Multiple inlets, new inlet<br />
formation, isl<strong>and</strong>s, shoals <strong>and</strong> deltas all contribute to a shifting<br />
fetch environment for portions of <strong>Pleasant</strong> <strong>Bay</strong>. The shoreline<br />
of <strong>Pleasant</strong> <strong>Bay</strong> is influenced by a combination of tidally induced<br />
transport, longshore sediment transport, coastal bank <strong>and</strong> dune<br />
erosion, barrier beach overwash, cross-shore sediment transport<br />
<strong>and</strong> aeolian transport. Each of these sediment transport processes<br />
is depicted on Figure 10 <strong>and</strong> is described below.<br />
4.3.1 Tidally Induced Transport<br />
Tidal forces influence all of <strong>Pleasant</strong> <strong>Bay</strong>, but are even more<br />
dominant near the inlets. Other coastal processes, such as<br />
longshore sediment transport, are more important in areas subject<br />
to significant wave action. At most inlets tidal currents are<br />
strong enough to suspend <strong>and</strong> move sediment. For this reason,<br />
some inlets can remain open without significant dredging. Tidal<br />
currents can be strong enough to shape those sections of beach<br />
immediately adjacent to the inlet. Inlet tidal currents are typically<br />
strongest <strong>and</strong> have the largest influence over sediment transport<br />
in the vicinity of inlets. The formation of a new tidal inlet can<br />
transport vast quantities of sediment in the form of shifting<br />
1 The USACE (EM 1110-2-1100) suggests that fetch <strong>and</strong> wind speed can be used to estimate the wave height <strong>and</strong> period from the deepwater equations, then if wave<br />
height exceeds 0.6 times the depth, wave height should be limited to 0.6 times the depth.<br />
14<br />
<strong>Pleasant</strong> <strong>Bay</strong> Alliance 2011
<strong>Coastal</strong> <strong>Resource</strong> <strong>Guide</strong> for <strong>Pleasant</strong> <strong>Bay</strong> <strong>and</strong> <strong>Chatham</strong> <strong>Harbor</strong><br />
migrating bars, ebb <strong>and</strong> flood deltas, <strong>and</strong> even the entire barrier<br />
isl<strong>and</strong> system. An example of an area dominated by tidal transport<br />
is Strong Isl<strong>and</strong>, which is close to the 2007 inlet <strong>and</strong> focuses tidal<br />
flow through channels adjacent to the isl<strong>and</strong>.<br />
Waves breaking on Nauset Beach at an angle can suspend <strong>and</strong> then<br />
transport sediment along the shoreline. Photo: Greg Berman<br />
4.3.2 Longshore Sediment Transport<br />
Waves typically break at an angle in the surf zone (not perfectly<br />
perpendicular to the shore), <strong>and</strong> so much of their energy is<br />
released in the form of a current that flows parallel to the<br />
shoreline. This wave-driven current moving along the coast is<br />
called the longshore current. If the waves have sufficient energy,<br />
they can mobilize sediment into the water column (e.g., due to<br />
wave breaking). This s<strong>and</strong> will be carried by the longshore current,<br />
moving it down the beach. This process of suspended s<strong>and</strong> being<br />
carried along the coast by the longshore current is referred to<br />
as longshore sediment transport, or drift. This process should<br />
not be thought of as s<strong>and</strong> flowing along the coast at a steady<br />
rate at all times. Rather, longshore sediment transport is better<br />
understood as an episodic event related to periods of high wave<br />
energy. Net longshore transport can be defined as the sum of<br />
sediment movement under all wave conditions (accounting for<br />
different transport directions), while gross longshore transport is<br />
total transport up <strong>and</strong> down the beach. Some beaches may have<br />
a large gross transport <strong>and</strong> a minimal net transport if there is not a<br />
dominant wind/wave direction.<br />
15<br />
Figure 10 illustrates the fundamental processes that move sediment along a generalized shoreline. Longshore Transport-a wave driven current<br />
moving along the coast is called the longshore current. The current can mobilize sediment into the water column <strong>and</strong> transport materials down<br />
the beach. This process is referred to as longshore sediment transport or longshore drift. Tidal-the ebb <strong>and</strong> flow of tidal waters mobilizing<br />
sediment can be dominant near inlets. Aeolian-strong winds can mobilize the s<strong>and</strong> along a dry beach. <strong>Coastal</strong> Bank <strong>and</strong> Dune Erosion-direct wave<br />
impact at the base removes material <strong>and</strong> subsequently can cause instability <strong>and</strong> collapse of portions above wave action. Overwash-the flow of<br />
water <strong>and</strong> sediment over a beach <strong>and</strong>/or dune that does not directly return to the ocean, this process typically forms a fan of material. Cross-<br />
Shore-a component of wave transport that moves sediment onshore <strong>and</strong> offshore. A winter beach profile is characterized by s<strong>and</strong> moving from<br />
the dry beach to shallow water areas offshore, in the summer months this s<strong>and</strong> is returned to the beach.<br />
<strong>Pleasant</strong> <strong>Bay</strong> Alliance 2011
<strong>Coastal</strong> <strong>Resource</strong> <strong>Guide</strong> for <strong>Pleasant</strong> <strong>Bay</strong> <strong>and</strong> <strong>Chatham</strong> <strong>Harbor</strong><br />
With larger waves there is a wider surf<br />
zone, stronger longshore currents,<br />
<strong>and</strong> an increase in the amount of<br />
s<strong>and</strong> that is suspended in the water<br />
column. As a result, little sediment<br />
may be transported over weeks/<br />
months of low wave energy followed<br />
by relatively large volumes of sediment<br />
being moved during a storm event.<br />
However, depending on the number<br />
<strong>and</strong> intensity of storm events,<br />
characteristic conditions of low wave<br />
energy may move more material over<br />
the course of a year.<br />
Where appropriate, the long-term<br />
direction of longshore sediment<br />
transport (or littoral drift) has been<br />
depicted as arrows on the Map 3 series.<br />
These arrows only indicate net direction of sediment transport<br />
<strong>and</strong> not the relative magnitude of transport. The direction of<br />
longshore sediment transport was delineated only where sufficient<br />
information was available to determine the net direction of<br />
sediment movement. Regions starved of natural littoral sediments<br />
may experience long-term weakening of the beach’s natural storm<br />
protection function. An example of an area dominated by this<br />
type of transport is the outer coast of the barrier beach (Nauset<br />
Beach), near the inlet, for which it has been well documented that<br />
sediment is being transported southward.<br />
Although all (or at least most) coastal processes influence sediment<br />
movement in every portion of the <strong>Bay</strong>, the dominant processes<br />
along the developed shorelines of <strong>Pleasant</strong> <strong>Bay</strong> are longshore <strong>and</strong><br />
tidally induced transport. The additional processes described below<br />
may be important in localized areas, but have relatively less impact<br />
in the overall system.<br />
4.3.3 <strong>Coastal</strong> Bank <strong>and</strong> Dune Erosion<br />
<strong>Coastal</strong> banks along the shore of <strong>Pleasant</strong> <strong>Bay</strong> are comprised of<br />
glacial sediments consisting primarily of gravelly s<strong>and</strong> with local<br />
fine-grained inclusions (silt <strong>and</strong> clay) <strong>and</strong> can include glacial till<br />
<strong>Coastal</strong> bank erosion at Namequoit Point. Photo: Judith Bruce<br />
Atlantic Ocean waves overwash Nauset Barrier Beach. Photo: Ted Keon<br />
(see Section 7.3, Surficial Geology). <strong>Coastal</strong> bank erosion provides<br />
an important source of material to beaches, tidal flats, <strong>and</strong> salt<br />
marshes. In general, the erosion of banks can be attributed to direct<br />
wave impact at the base, which removes material. Following the<br />
erosion at the base of the bank, the upper portions may collapse<br />
under their own weight, falling to the beach below. Alternately,<br />
scarped dunes can heal between storm events, <strong>and</strong> vegetation can<br />
colonize in the newly built-up sediment. This process is known<br />
as dune prograding. Other mechanisms that can play a role<br />
in bank <strong>and</strong> dune erosion include upl<strong>and</strong> runoff, groundwater<br />
seepage through the bank face, freezing <strong>and</strong> thawing cycles, <strong>and</strong><br />
direct erosion from wind <strong>and</strong> rain. It should also be noted that<br />
bank erosion is largely an episodic event, corresponding to storm<br />
conditions with high water levels <strong>and</strong> large waves. This episodic<br />
erosion should be kept in mind when considering average erosion<br />
rates for banked shorelines. An example of an area dominated<br />
by this type of transport is recent erosion at Namequoit Point, as<br />
shown in the picture at left.<br />
4.3.4 Barrier Beach Overwash<br />
Overwash is the flow of water <strong>and</strong> sediment over a beach <strong>and</strong>/<br />
or dune crest that does not directly return to the ocean. Overwash<br />
begins when the runup level of waves, usually coinciding with a<br />
storm surge, exceeds the local beach or dune crest height. As the<br />
water level in the ocean rises to a level where the beach or dune<br />
crest is over-topped, a steady sheet of water <strong>and</strong> sediment runs<br />
over the backside of the barrier beach, forming overwash fans<br />
that may serve as platforms for future salt marsh development.<br />
Along barrier beach systems, s<strong>and</strong> derived from the beach face is<br />
transported by waves into the bays or harbors backing the barrier.<br />
On undeveloped barrier beaches, overwash <strong>and</strong> aeolian transport<br />
are the mechanisms by which the barrier migrates l<strong>and</strong>ward in<br />
response to sea level rise (known as “rollover”), maintaining the<br />
integrity of the barrier beach system. As a result of major storms,<br />
dunes can be destroyed or weakened along barrier beaches. Barrier<br />
beach weakening typically is temporary, as natural coastal processes<br />
rebuild the barrier. An example of an area dominated by this type<br />
of transport is the bayside of the barrier beach that is comprised of<br />
overwash fans that have been colonized by salt marsh.<br />
16<br />
<strong>Pleasant</strong> <strong>Bay</strong> Alliance 2011
<strong>Coastal</strong> <strong>Resource</strong> <strong>Guide</strong> for <strong>Pleasant</strong> <strong>Bay</strong> <strong>and</strong> <strong>Chatham</strong> <strong>Harbor</strong><br />
winter months, while during summer months this s<strong>and</strong> is returned<br />
to the beach. In general, steeper, high-energy waves during the<br />
winter months cause sediment to move seaward <strong>and</strong> the milder<br />
late spring through fall wave climate causes s<strong>and</strong> to migrate<br />
back onto the beach face. The movement of s<strong>and</strong> back <strong>and</strong> forth<br />
perpendicular to the shoreline is called cross-shore sediment<br />
transport. This process can be dominant on relatively short beaches<br />
between sections of erosion-resistant coast, where there is little<br />
opportunity for a strong longshore current to be generated. An<br />
example of an area dominated by this type of transport can be<br />
the coves <strong>and</strong> ponds throughout the bay, or the summer/winter<br />
profiles of the ocean-facing barrier beach.<br />
A widened “summer” beach profile at Scatteree will narrow as on<br />
shore sediments are moved offshore by winter storms. Photo: Greg<br />
Berman<br />
4.3.5 Cross-Shore Sediment Transport<br />
In addition to s<strong>and</strong> moving parallel to the coast, there is also<br />
a component of transport that moves sediment onshore <strong>and</strong><br />
offshore (i.e., cross-shore transport). A familiar example of this is<br />
the formation of a winter beach profile, where s<strong>and</strong> is moved from<br />
the dry beach to shallow water areas offshore, typically forming a<br />
nearshore bar. Offshore s<strong>and</strong> migration typically occurs during the<br />
4.3.6 Aeolian Transport<br />
Under strong enough winds, the s<strong>and</strong> along the dry beach can<br />
be mobilized <strong>and</strong> carried away from its original location. This<br />
transport of dry s<strong>and</strong> by wind forces, called aeolian transport, is<br />
typically less dominant on an estuarine shoreline due to reduced<br />
fetch, availability of sediments, <strong>and</strong> dense vegetation. Any<br />
impediment to the s<strong>and</strong>’s movement along the beach can serve to<br />
limit windblown transport. Fencing <strong>and</strong> beach grass planting are<br />
common examples of such efforts to limit aeolian transport <strong>and</strong>/or<br />
encourage the deposition of wind blown s<strong>and</strong>s in specific locations<br />
such as on an existing dune. An example of an area dominated<br />
by this type of natural transport is the extensive dune system on<br />
Nauset Beach.<br />
17<br />
The extensive dune system on Nauset Beach is an example of an area dominated by aeolian transport. Photo by Greg Berman<br />
<strong>Pleasant</strong> <strong>Bay</strong> Alliance 2011
<strong>Coastal</strong> <strong>Resource</strong> <strong>Guide</strong> for <strong>Pleasant</strong> <strong>Bay</strong> <strong>and</strong> <strong>Chatham</strong> <strong>Harbor</strong><br />
Section 5<br />
<strong>Coastal</strong> Structures<br />
5.1 Purpose<br />
The purpose of this section is to describe <strong>and</strong> illustrate the type<br />
<strong>and</strong> distribution of coastal structures within the <strong>Pleasant</strong> <strong>Bay</strong><br />
system. The function of coastal structures <strong>and</strong> their potential<br />
impacts to the coastal zone also are described.<br />
5.2 Methodology<br />
The type, number <strong>and</strong> distribution of coastal structures in <strong>Pleasant</strong><br />
<strong>Bay</strong> were derived from a combination of existing geospatial<br />
data <strong>and</strong> local knowledge. In 1996, large-scale base maps with<br />
parcel boundaries produced by the Cape Cod Commission were<br />
used by local resource managers (<strong>Harbor</strong>masters, Conservation,<br />
Environmental Staff) to map the approximate locations of coastal<br />
structures around the <strong>Bay</strong>. The locations were then digitized by the<br />
Cape Cod Commission for mapping purposes <strong>and</strong> a GIS database<br />
was created for the 1998 <strong>Pleasant</strong> <strong>Bay</strong> <strong>Resource</strong> Management<br />
Plan. The 1996 data was augmented with more recent data<br />
taken from field observations by local resource managers involved<br />
with the 2008 plan update. The location of many of the soft<br />
shoreline structures were provided by conservation permitting<br />
records. Shoreline structures in the <strong>Chatham</strong> section are currently<br />
being updated using information derived from aerial photography.<br />
5.3 <strong>Coastal</strong> Structures<br />
<strong>Coastal</strong> structures in <strong>Pleasant</strong> <strong>Bay</strong> include shorefront protection<br />
structures, as well as piers, docks, floats, <strong>and</strong> elevated walkways,<br />
etc. Shorefront protection structures (“hard structures”) <strong>and</strong> other<br />
approaches (“soft solutions” such as fiber rolls, pictured right)<br />
are used to manage shoreline erosion, especially on developed<br />
coasts. Revetments, bulkheads, <strong>and</strong> gabions are examples of hard<br />
structures, while soft structures or soft stabilization techniques<br />
include fiber rolls, artificial dunes with beach grass plantings or<br />
fencing, <strong>and</strong> beach nourishment.<br />
Section Highlights<br />
<strong>Coastal</strong> structures in <strong>Pleasant</strong> <strong>Bay</strong> include shorefront<br />
protection structures to manage coastal erosion <strong>and</strong><br />
docks <strong>and</strong> piers to provide water access. In 2007,<br />
approximately 160 piers <strong>and</strong> docks were located<br />
around the <strong>Bay</strong>. These structures may impact coastal<br />
environments by altering water circulation <strong>and</strong><br />
causing scour, or by shading vegetation.<br />
“Hard” shorefront protection structures include<br />
revetments, bulkheads, <strong>and</strong> gabions. In 2007, there<br />
were 132 hard structures around the <strong>Bay</strong>. These<br />
mostly permanent structures may affect sediment<br />
dynamics along the shore by inhibiting bank<br />
erosion, causing scour near the base <strong>and</strong>/or end of<br />
the structure <strong>and</strong> lowering of beach profile on the<br />
fronting beach.<br />
Soft stabilization structures or solutions around the<br />
<strong>Bay</strong> include fiber rolls, artificial dunes with plantings<br />
or fencing, <strong>and</strong> beach nourishment. They are fewer in<br />
number (28), but have become increasingly common.<br />
Regulatory agencies typically prefer soft shore<br />
protection solutions since they are less permanent<br />
<strong>and</strong> typically cause fewer impacts to the shore.<br />
The growing number of docks <strong>and</strong> piers<br />
in <strong>Pleasant</strong> <strong>Bay</strong> was a major impetus<br />
for the <strong>Bay</strong>’s designation as an ACEC<br />
<strong>and</strong> the subsequent development<br />
of a resource management plan for<br />
the <strong>Bay</strong>. In an effort to assist towns<br />
around the <strong>Bay</strong> in developing specific<br />
regulatory or bylaw changes relative<br />
to the permitting of docks, piers,<br />
walkways <strong>and</strong> stairways, the <strong>Pleasant</strong><br />
<strong>Bay</strong> <strong>Resource</strong> Management Alliance<br />
issued <strong>Guide</strong>lines <strong>and</strong> Performance<br />
St<strong>and</strong>ards for Permitting Docks <strong>and</strong> Piers<br />
in <strong>Pleasant</strong> <strong>Bay</strong> in 1999 <strong>and</strong> <strong>Guide</strong>lines<br />
for Private Walkways <strong>and</strong> Stairways in<br />
Fresh <strong>and</strong> Marine <strong>Resource</strong> Areas in<br />
<strong>Pleasant</strong> <strong>Bay</strong> in 2002. These documents<br />
recommend design criteria <strong>and</strong><br />
performance st<strong>and</strong>ards for construction<br />
of these structures in order to minimize<br />
Fiber rolls, considered a “soft solution,” can be covered over with vegetation to restore a natural<br />
appearance <strong>and</strong> functioning of a coastal bank. Photo: Kristin Andres 18<br />
<strong>Pleasant</strong> <strong>Bay</strong> Alliance 2011
<strong>Coastal</strong> <strong>Resource</strong> <strong>Guide</strong> for <strong>Pleasant</strong> <strong>Bay</strong> <strong>and</strong> <strong>Chatham</strong> <strong>Harbor</strong><br />
A small stony beach at the base of this rock revetment leaves little<br />
adjacent sediment supply to fronting fringe marsh. Photo: Kristen<br />
Andres.<br />
Gabions (wire boxes filled with rocks) can absorb wave energy <strong>and</strong><br />
allow water to penetrate. Photo: Kristin Andres<br />
their impacts to marine habitats, wildlife, fisheries, <strong>and</strong> marshes.<br />
The guidelines also encourage “shared-use” proposals (i.e., a single<br />
structure jointly owned <strong>and</strong> used by two or more property owners)<br />
to preserve access to the shore while reducing the overall number<br />
of structures that might otherwise be permitted.<br />
5.3.1 Shorefront Protection Structures<br />
Hard shoreline structures, have increasingly been used to protect<br />
private property along the shore from storm damage that has<br />
been amplified by changes associated with recent breaches of<br />
the Nauset Barrier Beach. These structures also can help stabilize<br />
shorelines for water-dependent uses, such as bulkheads at the<br />
<strong>Chatham</strong> Fish Pier. Although shoreline protection structures protect<br />
harbor infrastructure <strong>and</strong> shoreline property, they can result in<br />
adverse impacts to coastal resources <strong>and</strong> public access. <strong>Coastal</strong><br />
armoring with seawalls <strong>and</strong> revetments prevents the natural<br />
erosion of coastal banks which provides sediment needed by<br />
beaches, dunes, tidal flats, <strong>and</strong> salt marshes to maintain themselves<br />
<strong>and</strong> keep pace with rising sea level. Beach width <strong>and</strong> height are<br />
typically reduced (“sediment starved”) downdrift of revetments<br />
<strong>and</strong> seawalls, weakening their storm damage prevention <strong>and</strong> flood<br />
control functions (ultimately causing downdrift property owners to<br />
install similar protective structures). Waves striking hard structures<br />
also cause turbulence, which, in turn, may erode <strong>and</strong> lower the<br />
profile of the beach fronting the seawall as well as adjacent<br />
beaches. Some beaches near hard structures have become stonier<br />
due to the winnowing away of s<strong>and</strong>. Soft structures, while not<br />
as permanent as hard structures, provide similar protection for<br />
a limited period of time with significantly fewer environmental<br />
impacts. Although soft shore protection solutions may require<br />
more frequent maintenance to remain effective, they may be less<br />
costly than hard structures over the long term.<br />
less coastal armoring in Little <strong>Pleasant</strong> <strong>Bay</strong> where fetch distances,<br />
<strong>and</strong> thus wave energy, are less. Over 130 hard structures (105<br />
revetments, 27 bulkheads) were in place around the <strong>Bay</strong> in<br />
2007, only slightly more than the number of hard structures in<br />
1998 (Table 2). Hard structures are especially common along the<br />
westernmost section of the <strong>Pleasant</strong> <strong>Bay</strong> shoreline (near Round<br />
Cove) where Route 28 parallels the shore, in Orleans near Quanset<br />
Pond, <strong>and</strong> the <strong>Chatham</strong> shore opposite the 1987 inlet breach.<br />
The number of soft shoreline structures installed around the <strong>Bay</strong><br />
increased significantly from five in 1998 to twenty-eight in 2007<br />
(Table 2), with most projects located along the south shore of<br />
<strong>Pleasant</strong> <strong>Bay</strong> <strong>and</strong> along adjoining embayments (e.g., Crows Pond,<br />
Ryders Cove <strong>and</strong> Bassing <strong>Harbor</strong>). State <strong>and</strong> local permitting<br />
agencies encourage the installation of soft structures where shore<br />
protection is needed, since they are generally less permanent<br />
<strong>and</strong> cause fewer adverse impacts to shore environments. The<br />
preference state <strong>and</strong> local permitting agencies have for soft shore<br />
stabilization techniques may be responsible for the increase in<br />
number of these projects around the <strong>Bay</strong> over the last decade.<br />
Some projects identified as “soft” erosion control solutions (e.g.,<br />
fiber rolls) function in a way similar to a hard structure due to<br />
design or the need to be anchored in some way, <strong>and</strong> may result in<br />
impacts similar to more permanent structures.<br />
Table 2. Erosion Control Structures on <strong>Pleasant</strong> <strong>Bay</strong><br />
Orleans Brewster <strong>Chatham</strong> Harwich 2007 1998<br />
total total<br />
Bulkheads 10 - 14 3 27 25<br />
Revetments 25 1 64 15 105 103<br />
Soft Solutions 8 - 20 - 28 5<br />
Total Number 43 1 98 23 165 133<br />
19<br />
The distribution of hard coastal structures is controlled by l<strong>and</strong><br />
development patterns <strong>and</strong> varying exposure to waves <strong>and</strong> tides<br />
around the <strong>Bay</strong> — see Map 4 Series. The majority of hard<br />
structures are located on the western <strong>and</strong> southern margins of<br />
<strong>Pleasant</strong> <strong>Bay</strong> <strong>and</strong> areas of <strong>Chatham</strong> <strong>Harbor</strong> near the inlets, with<br />
<strong>Pleasant</strong> <strong>Bay</strong> Alliance 2011
<strong>Coastal</strong> <strong>Resource</strong> <strong>Guide</strong> for <strong>Pleasant</strong> <strong>Bay</strong> <strong>and</strong> <strong>Chatham</strong> <strong>Harbor</strong><br />
Docks extend below mean low water, which means they extend into Commonwealth tidel<strong>and</strong>s where the public has access <strong>and</strong> usage rights.<br />
Photo: Kristin Andres<br />
5.3.2 Piers <strong>and</strong> Docks<br />
Piers <strong>and</strong> docks are a critical part of the infrastructure of working<br />
harbors, such as <strong>Chatham</strong> <strong>Harbor</strong>, <strong>and</strong> provide other commercial<br />
<strong>and</strong> recreational boaters easy access to their boats from the<br />
shore. When properly constructed, they allow boat owners to<br />
reach their vessels during all tides. They also provide a platform<br />
for loading <strong>and</strong> offloading, <strong>and</strong> temporary storage space for<br />
marine supplies <strong>and</strong> equipment. Piers <strong>and</strong> docks can minimize<br />
damage to the shore that would otherwise occur in their absence<br />
by keeping boats, people, <strong>and</strong> other materials off sensitive coastal<br />
environments.<br />
Although most piers <strong>and</strong> docks are privately owned, they typically<br />
occupy public waters <strong>and</strong> extend across l<strong>and</strong>s where the public has<br />
access <strong>and</strong> usage rights.<br />
Docks <strong>and</strong> piers are common along most of the bay shoreline<br />
except for the Nauset barrier, <strong>Chatham</strong> <strong>Harbor</strong> shore, <strong>and</strong> the bay<br />
isl<strong>and</strong>s where these structures are few or non-existent. Docks <strong>and</strong><br />
piers are especially common along The River, Crows Pond, Ryders<br />
Cove, <strong>and</strong> along the westernmost shore near Route 28. The 2008<br />
<strong>Pleasant</strong> <strong>Bay</strong> Management Plan identifies roughly 160 docks <strong>and</strong><br />
<strong>Pleasant</strong> <strong>Bay</strong> Alliance 2011<br />
piers in the management plan study area. These structures are<br />
shown on Map 5.<br />
As with other coastal structures, piers <strong>and</strong> docks may adversely<br />
impact sensitive coastal resources. For example, the installation<br />
of pilings supporting a pier or dock may alter water circulation,<br />
which may cause sediment erosion <strong>and</strong> scour. Marsh <strong>and</strong> eelgrass<br />
vegetation may be affected by shading caused by decking on a<br />
pier. Stairways leading to piers <strong>and</strong> docks can have similar impacts<br />
to dune vegetation <strong>and</strong>/or potentially de-stabilize bank vegetation<br />
<strong>and</strong> soils. Benthic communities may also be affected by shading,<br />
especially by floats which cover a larger area. In addition, floats<br />
can directly impact benthic marine organisms if they settle on the<br />
substrate at low tides. The leaching of wood preservatives (e.g.,<br />
wood treated with copper chromated arsenic, or CCA) from piers<br />
<strong>and</strong> docks into the marine environment can have toxic effects on<br />
marine organisms. In addition, the use of heavy equipment for<br />
installing coastal structures may have significant impacts on marine<br />
environments, potentially damaging valuable resources such as<br />
shellfish beds that may require years to recover, if ever.<br />
20
<strong>Coastal</strong> <strong>Resource</strong> <strong>Guide</strong> for <strong>Pleasant</strong> <strong>Bay</strong> <strong>and</strong> <strong>Chatham</strong> <strong>Harbor</strong><br />
21<br />
Section 6<br />
<strong>Coastal</strong> Vulnerability<br />
6.1 Purpose<br />
The purpose of this section is to explain the vulnerability of<br />
natural resources, coastal l<strong>and</strong>forms <strong>and</strong> human infrastructure<br />
in the <strong>Pleasant</strong> <strong>Bay</strong> system to the effects of coastal storm surge,<br />
flooding, erosion <strong>and</strong> sea level rise.<br />
6.2 <strong>Coastal</strong> Vulnerability<br />
The Barnstable County Pre-Disaster Mitigation Plan defines<br />
vulnerability as susceptibility to attack or injury by identified<br />
hazards. Vulnerability could be measured in terms of loss<br />
or private property, loss of tax base, or damage to public<br />
infrastructure. Hazard mitigation planning is a process of<br />
assessing risks associated with hazards, <strong>and</strong> preparing strategies<br />
to minimize the impact or damage those hazards may cause.<br />
The county plan identifies the following potential hazards (in<br />
order of priority): flooding, shoreline change (from sea level rise<br />
or storm induced), wildfire (following drought), snow <strong>and</strong> ice<br />
accumulation, wind, drought, tornado, earthquake. The plan<br />
also notes that climate change could increase the frequency or<br />
severity of hazards, <strong>and</strong> should be considered in ongoing hazard<br />
mitigation planning.<br />
6.2.1 <strong>Coastal</strong> Flooding<br />
<strong>Coastal</strong> flooding represents a frequently occurring threat to<br />
natural resources <strong>and</strong> human infrastructure located within the<br />
various flood plains surrounding the <strong>Pleasant</strong> <strong>Bay</strong> estuary. Rising<br />
sea levels caused by global warming are projected to increase<br />
the frequency <strong>and</strong> severity of damaging storm surges <strong>and</strong> coastal<br />
flooding. The creation of the new inlet in April 2007, has<br />
resulted in increased tidal ranges throughout the <strong>Bay</strong>, <strong>and</strong> has<br />
helped to amplify the combined impacts from increased storm<br />
frequencies <strong>and</strong> severity. <strong>Pleasant</strong> <strong>Bay</strong> is susceptible to storm<br />
surges from episodic storm events, such as large hurricanes, as<br />
well as our more common winter “nor’easters”. Map 6 shows<br />
major storm <strong>and</strong> hurricane paths since 1900.<br />
Severe winter low-pressure systems (nor’easters) represent the<br />
greatest coastal flooding threat to <strong>Pleasant</strong> <strong>Bay</strong>. This threat<br />
is exacerbated by the orientation of the two inlets relative to<br />
the northeast set of the storm waves, <strong>and</strong> due to the relatively<br />
slow rate of speed at which these systems move. During these<br />
storm events, water is forced into the <strong>Pleasant</strong> <strong>Bay</strong> system from<br />
large storm driven waves, which increase normal tidal height.<br />
Persistent storm waves restrict the discharge of water from the<br />
<strong>Bay</strong> on outgoing tidal cycles, <strong>and</strong> effectively trap water within<br />
the system. When these low-pressure storm systems stall, as<br />
often happens, they can impact the area over multiple tidal<br />
cycles. Each successive tidal cycle is amplified by water already<br />
trapped in the <strong>Bay</strong>, <strong>and</strong> results in repetitive storm surges during a<br />
storm event.<br />
Currently most coastal floodplain regulations <strong>and</strong> planning<br />
efforts are based upon the Federal Management Agency (FEMA)<br />
Section Highlights<br />
The shoreline <strong>and</strong> low lying upl<strong>and</strong>s surrounding<br />
<strong>Pleasant</strong> <strong>Bay</strong> <strong>and</strong> <strong>Chatham</strong> <strong>Harbor</strong> are vulnerable to<br />
damage caused by storm-induced flooding, surge, <strong>and</strong><br />
erosion. These conditions <strong>and</strong> the resulting impacts<br />
could be worsened as sea level rises over the coming<br />
decades as predicted.<br />
Vulnerability is measurable in terms of loss of natural<br />
resources, habitat, <strong>and</strong> coastal l<strong>and</strong>forms that create<br />
our coastal l<strong>and</strong>scape <strong>and</strong> buffer <strong>and</strong> help to protect<br />
the shoreline. It is also measurable in terms of loss<br />
of property, public access to the shoreline, <strong>and</strong><br />
infrastructure.<br />
Further study to underst<strong>and</strong> how sea level rise could<br />
alter Cape Cod’s shoreline <strong>and</strong> possible ways of adapting<br />
is advisable, but is outside the scope of this <strong>Guide</strong>. In<br />
the interim, communities can take steps to mitigate<br />
coastal hazards. These steps include acquiring or<br />
protecting coastal property to allow for inl<strong>and</strong> migration<br />
of wetl<strong>and</strong>s, relocating valuable infrastructure, <strong>and</strong><br />
removing unnecessary coastal armoring.<br />
Flood Insurance Rate Maps (FIRM) or Flood Hazard Boundary<br />
Map. These maps identify geographic areas, called flood zones,<br />
according to varying levels of flood risk. Each zone reflects the<br />
severity or type of flooding in the area. FEMA has developed these<br />
FIRM maps for all coastal communities in the United States.<br />
FEMA A zones are areas with a 1% annual chance of flooding <strong>and</strong><br />
a 26% chance of flooding over the life of a 30-year mortgage.<br />
Because detailed analyses are not performed for such areas, no<br />
depths or base flood elevations are shown within these zones.<br />
FEMA V zones are coastal areas with a 1% or greater chance of<br />
flooding <strong>and</strong> an additional hazard associated with storm waves.<br />
These areas have a 26% chance of flooding over the life of a 30-<br />
year mortgage. No base flood elevations are shown within these<br />
zones.<br />
Map 7 shows the location of A <strong>and</strong> V zones in <strong>Pleasant</strong> <strong>Bay</strong> <strong>and</strong><br />
<strong>Chatham</strong> <strong>Harbor</strong>. The map also illustrates areas of repetitive loss<br />
claims from the federal flood insurance program.<br />
All coastal flood plains surrounding <strong>Pleasant</strong> <strong>Bay</strong> <strong>and</strong> <strong>Chatham</strong><br />
<strong>Harbor</strong> will see increased flood levels over time, <strong>and</strong> planning<br />
for future coastal flooding will require new methods <strong>and</strong><br />
metrics. Present flood hazard maps <strong>and</strong> flood plain planning <strong>and</strong><br />
management concepts will prove ineffective if they do not<br />
<strong>Pleasant</strong> <strong>Bay</strong> Alliance 2011
<strong>Coastal</strong> <strong>Resource</strong> <strong>Guide</strong> for <strong>Pleasant</strong> <strong>Bay</strong> <strong>and</strong> <strong>Chatham</strong> <strong>Harbor</strong><br />
account for sea level rise. FEMA FIRM maps do not account for<br />
anticipated sea level rise, <strong>and</strong> are frequently based on decades<br />
old flood studies. <strong>Pleasant</strong> <strong>Bay</strong> communities will need to develop<br />
additional tools to help them plan for future flooding <strong>and</strong><br />
conduct risk assessments for public <strong>and</strong> private infrastructure <strong>and</strong><br />
natural resources. The continued study <strong>and</strong> monitoring of local<br />
tidal regimes within the <strong>Pleasant</strong> <strong>Bay</strong> system is essential for the<br />
development of future flood hazard mapping <strong>and</strong> risk assessment.<br />
Other tools, including airborne Light Detection <strong>and</strong> Ranging<br />
(LIDAR) used to delineate coastal topography (i.e., l<strong>and</strong> elevation)<br />
with high precision; accurate bay-wide bathymetry maps <strong>and</strong><br />
sophisticated dynamic computer models will also be necessary for<br />
the development of predictive flood hazard data.<br />
While all floodplains will continue to be affected by coastal<br />
flooding, areas most vulnerable to coastal flooding are located<br />
within the FEMA mapped flood zones closest to the two inlets.<br />
Over time, future flood hazards will be better understood for all<br />
areas of the <strong>Pleasant</strong> <strong>Bay</strong> system, <strong>and</strong> communities can develop<br />
<strong>and</strong> implement appropriate hazard management measures.<br />
6.2.2 Shoreline Change from Erosion <strong>and</strong> Sea Level<br />
Rise<br />
<strong>Coastal</strong> erosion is another response to increased tidal ranges, rising<br />
sea level <strong>and</strong> increased storm frequency <strong>and</strong> severity. Erosion is a<br />
process that provides sediments to adjacent dunes, beaches <strong>and</strong><br />
marshes within the littoral system. Erosion is a process that occurs<br />
in nature. However, the natural rate or pattern of erosion may<br />
be influenced by coastal armoring or other human activity that<br />
interferes with the natural movement of sediments. The rate of<br />
sea level rise also may expedite the process of erosion.<br />
A fuller picture of the effects of SLR in <strong>Pleasant</strong> <strong>Bay</strong> <strong>and</strong> <strong>Chatham</strong><br />
<strong>Harbor</strong> would require further data collection <strong>and</strong> analysis. In the<br />
future, this degree of detailed analysis may be warranted to guide<br />
local planning <strong>and</strong> management responses. At this time there<br />
are general strategies for preparing for sea level rise that could be<br />
considered. These include:<br />
• Acquiring coastal property to protect access, reduce property<br />
<strong>and</strong> infrastructure damage <strong>and</strong> improve the functioning of<br />
coastal processes;<br />
• Relocating vulnerable infrastructure;<br />
• Removing unnecessary, dangerous or damaging coastal<br />
armoring;<br />
• Developing improved regulations to protect coastal systems <strong>and</strong><br />
beaches;<br />
• Encouraging l<strong>and</strong>owners to obtain conservation easements for<br />
unarmored bluffs that provide sediment to down drift beaches<br />
(Theiler, 2009).<br />
Some areas of <strong>Pleasant</strong> <strong>Bay</strong> <strong>and</strong> <strong>Chatham</strong> <strong>Harbor</strong>, particularly<br />
in the vicinity of the 1987 <strong>and</strong> 2007 inlets, have experienced<br />
significant erosion. The areas currently experiencing the most<br />
erosion are located on the east facing <strong>Chatham</strong> shoreline<br />
opposite the 2007 inlet, as well as most other unarmored east<br />
facing properties throughout the <strong>Bay</strong>. The primary management<br />
response to coastal erosion has been an increase in coastal erosion<br />
control structures though out the <strong>Bay</strong> (see Section 5). Many town<br />
l<strong>and</strong>ings have lost significant areas of beach over recent years.<br />
Some of <strong>Chatham</strong>’s town l<strong>and</strong>ings, such as Scatteree <strong>and</strong> Strong<br />
Isl<strong>and</strong> Road, have required regular s<strong>and</strong> nourishment as a result<br />
of erosion. Much of Jacknife Beach in <strong>Chatham</strong> has been lost to<br />
erosion, <strong>and</strong> the parking lot experiences frequent flooding.<br />
Sea Level Rise (SLR) will continue to be a factor in shoreline change<br />
caused by flooding <strong>and</strong> storm surges as well as coastal erosion.<br />
The effects of rising sea level can be magnified by human actions<br />
such as coastal armoring. Recent reports suggest that sea level will<br />
rise by approximately one meter by 2100. This degree of change,<br />
coupled with increased potential for storm surge, would be<br />
expected to have significant effects such as loss of coastal habitats<br />
<strong>and</strong> resources, increased coastal erosion, loss of recreational<br />
resources such as beaches <strong>and</strong> marshes, salt-water intrusion into<br />
wells <strong>and</strong> septic systems, elevated storm surge levels, <strong>and</strong> more<br />
frequent coastal inundation (Theiler, 2009).<br />
22<br />
<strong>Pleasant</strong> <strong>Bay</strong> Alliance 2011
<strong>Coastal</strong> <strong>Resource</strong> <strong>Guide</strong> for <strong>Pleasant</strong> <strong>Bay</strong> <strong>and</strong> <strong>Chatham</strong> <strong>Harbor</strong><br />
Section 7<br />
Natural <strong>Resource</strong>s<br />
23<br />
7.1 Purpose<br />
The purposes of this section are to briefly describe the region’s<br />
glacial history <strong>and</strong> sediment regime, <strong>and</strong> to illustrate the breadth of<br />
natural resources in the <strong>Pleasant</strong> <strong>Bay</strong> system, including the current<br />
status of water quality in the <strong>Bay</strong>.<br />
7.2 Methodology<br />
Narratives describing the <strong>Bay</strong>’s diverse natural resources are based<br />
on previous scientific studies <strong>and</strong> resource management plans<br />
for the <strong>Bay</strong>, as well as information from local town officials. GIS<br />
data depicting wildlife habitats was supplemented by information<br />
from Mass Audubon staff familiar with the <strong>Bay</strong>. Water quality<br />
information was derived from studies determining critical nitrogen<br />
loading thresholds. Robert Oldale’s 2001 publication describing the<br />
geology of Cape Cod <strong>and</strong> the Isl<strong>and</strong>s provided useful information<br />
about the glacial history <strong>and</strong> geology of the bay area.<br />
The location <strong>and</strong> distribution of natural resources in the <strong>Bay</strong> is based<br />
on existing maps, Geographic Information System (GIS) data layers<br />
(including MORIS <strong>and</strong> ESI data layers), <strong>and</strong> local knowledge.<br />
<strong>Coastal</strong> wetl<strong>and</strong> resource areas (e.g., dune, salt marsh, etc.),<br />
eelgrass, fish <strong>and</strong> wildlife, <strong>and</strong> priority natural community types<br />
are delineated by MORIS <strong>and</strong> ESI data mapping. MORIS, the<br />
Massachusetts Ocean <strong>Resource</strong> Information System, is an online<br />
mapping tool created by Massachusetts Office of <strong>Coastal</strong> Zone<br />
Management (CZM) <strong>and</strong> the Massachusetts Office of Geographic<br />
Information (MassGIS). MORIS can be used to search <strong>and</strong><br />
display spatial data related to the Massachusetts coastal zone<br />
(e.g., eelgrass beds, coastal wetl<strong>and</strong>s, shore access points, etc.)<br />
on a backdrop of aerial photographs. Environmental Sensitivity<br />
Index (ESI) maps delineate coastal resources that are at risk,<br />
including biological resources, in a geodatabase format. The<br />
Massachusetts Environmental Sensitivity Index Metadata (April<br />
2000) provides attribute definition <strong>and</strong> source information.<br />
7.3 Surficial Geology<br />
The type <strong>and</strong> distribution of natural resources in <strong>and</strong> around<br />
<strong>Pleasant</strong> <strong>Bay</strong> <strong>and</strong> <strong>Chatham</strong> <strong>Harbor</strong> are largely influenced by<br />
the area’s Pleistocene glacial history <strong>and</strong> the diverse types <strong>and</strong><br />
distribution of sediments deposited during this time. The surficial<br />
geology of Cape Cod, including the <strong>Pleasant</strong> <strong>Bay</strong> area, owes its<br />
origin to the last continental glacier (Laurentide ice sheet) <strong>and</strong><br />
the subsequent rise in sea-level. The dynamics <strong>and</strong> timing of<br />
glaciation as well as the variety of deposits left by the glacier as<br />
it advanced <strong>and</strong> retreated over the l<strong>and</strong>scape of Cape Cod is<br />
described in detail by Robert Oldale in his book Cape Cod, Martha’s<br />
Vineyard & Nantucket: The Geologic Story (Oldale, 2001). Three<br />
broad categories of glacial sediments were deposited during the<br />
Pleistocene epoch (10,000 years or older) on the Cape: glacial<br />
till, glacial moraine deposits, <strong>and</strong> glacial stratified deposits (Stone<br />
& DiGiacomo-Cohen, 2009). Glacial till consists of unsorted <strong>and</strong><br />
unstratified sediments of various grain sizes (boulders, gravel,<br />
s<strong>and</strong>, silt, clay) deposited directly on bedrock by the glacier. Glacial<br />
Section Highlights<br />
<strong>Pleasant</strong> <strong>Bay</strong> supports a wide variety of inl<strong>and</strong> <strong>and</strong><br />
coastal wetl<strong>and</strong> resources, fish <strong>and</strong> wildlife, <strong>and</strong> many<br />
rare species <strong>and</strong> natural community types.<br />
<strong>Coastal</strong> <strong>and</strong> inl<strong>and</strong> wetl<strong>and</strong>s serve important public<br />
interests such as flood control, storm damage<br />
prevention, pollution prevention, <strong>and</strong> marine <strong>and</strong><br />
terrestrial wildlife habitat.<br />
Approximately 1,400 acres of salt marsh <strong>and</strong> 225 acres<br />
of intertidal flats exist in the <strong>Bay</strong>. Several areas of salt<br />
marsh <strong>and</strong> tidal flat in the <strong>Bay</strong> are identified as “Areas<br />
of Critical Marine Habitat” based on their habitat values<br />
for coastal waterbirds, horseshoe crabs, <strong>and</strong> the rare<br />
diamondback terrapin.<br />
Over 1,800 acres of eelgrass beds occur in the <strong>Bay</strong>. These<br />
highly productive subtidal communities provide feeding<br />
<strong>and</strong> nursery habitat for many marine species, including<br />
many commercially valuable finfish <strong>and</strong> shellfish species.<br />
Seven rare wildlife species have been documented using<br />
bay habitats, including Piping Plover, Northern Harrier,<br />
<strong>and</strong> Diamondback terrapin. Many other rare species<br />
occur within the study area.<br />
Nutrient impacts on <strong>Bay</strong> water quality have been<br />
monitored since 2000, <strong>and</strong> data were used to identify<br />
threshold limits for Total Nitrogen. Reductions in current<br />
watershed nitrogen load will be needed to maintain or<br />
restore healthy water quality. Increased flushing from<br />
the 2007 inlet did not result in changes sufficient to<br />
mitigate the effects of watershed nitrogen loading.<br />
moraine deposits are similarly unsorted <strong>and</strong> unstratified, s<strong>and</strong>y<br />
sediments with coarser materials including boulders. Moraine<br />
deposits accumulated in ice-walled lakes <strong>and</strong> streams <strong>and</strong> on<br />
stagnant, buried ice in front of the receding edge of the ice sheet.<br />
Glacial stratified deposits are layered, well-sorted to poorlysorted<br />
gravel, s<strong>and</strong>, silt <strong>and</strong> clay laid down by flowing meltwater<br />
in glacial streams <strong>and</strong> lakes in front of the retreating ice margin<br />
(identified as “coarse” in Map 9). The glacial stratified deposits<br />
on Cape Cod (e.g., Harwich outwash plain deposits) are the most<br />
extensive in Massachusetts. These broad, gently sloping plains<br />
are sometimes pitted, forming dry depressions or kettle ponds<br />
where the depressions intersect groundwater. Less common are<br />
glacial lake sediments composed of gravelly s<strong>and</strong>, silt <strong>and</strong> clay<br />
that were deposited in lakes impounded by glacial ice (identified<br />
as “glaciolacustrine fine” in Map 9). The diverse sediment<br />
types deposited by the Laurentide ice sheet comprise the parent<br />
materials of the Cape’s modern sedimentary environments. Rising<br />
sea-levels reworked the glacial sediments forming beaches, dunes<br />
<strong>Pleasant</strong> <strong>Bay</strong> Alliance 2011
<strong>Coastal</strong> <strong>Resource</strong> <strong>Guide</strong> for <strong>Pleasant</strong> <strong>Bay</strong> <strong>and</strong> <strong>Chatham</strong> <strong>Harbor</strong><br />
<strong>and</strong> marshes during the Holocene epoch (post-glacial, less than<br />
10,000 years old). Bedrock is not exposed on the Cape due to the<br />
thick layer of glacial sediments.<br />
The distribution <strong>and</strong> types of surficial geologic deposits around<br />
<strong>Pleasant</strong> <strong>Bay</strong> is shown on the U.S. Geological Survey’s <strong>Chatham</strong><br />
<strong>and</strong> Orleans geologic quadrangle maps (Map 9) (Stone &<br />
DiGiacomo-Cohen, 2009). Glacial stratified deposits (“coarse”)<br />
comprise almost all of the upl<strong>and</strong>s (not including Nauset Beach)<br />
surrounding the <strong>Pleasant</strong> <strong>Bay</strong> <strong>and</strong> <strong>Chatham</strong> <strong>Harbor</strong>. This map unit<br />
consists of stratified s<strong>and</strong> <strong>and</strong> gravel deposits laid down in various<br />
depositional environments in front of the retreating ice margin<br />
(e.g., meltwater stream, lake deltas, etc.). The sediment layers<br />
may be poorly sorted in gravel deposits to well-sorted in s<strong>and</strong> <strong>and</strong><br />
gravel deposits, with faulted bedding due to post-depositional<br />
collapse.<br />
Post-glacial deposits in the region surrounding <strong>Pleasant</strong> <strong>Bay</strong> <strong>and</strong><br />
<strong>Chatham</strong> <strong>Harbor</strong> include beaches, dunes, salt marshes, freshwater<br />
swamp <strong>and</strong> marsh deposits, as well as artificial fill. Beaches are<br />
typically linear, narrow deposits of s<strong>and</strong> <strong>and</strong> fine gravel reworked<br />
by waves <strong>and</strong> currents. The texture of beach deposits varies locally<br />
<strong>and</strong> is generally controlled by the sediment composition of nearby<br />
glacial materials eroded by wave action. Dunes are wind-deposited<br />
s<strong>and</strong>s <strong>and</strong> granules derived from beaches, which may consist of<br />
cross-bedded deposits up to 100 feet thick. Nauset Beach <strong>and</strong><br />
North Beach Isl<strong>and</strong> are composed of beaches <strong>and</strong> extensive dunes,<br />
with localized areas of storm beach deposits (e.g., overwash fans,<br />
channels) consisting of s<strong>and</strong> <strong>and</strong> gravel deposited by high energy<br />
storm waves. Beach <strong>and</strong> dune deposits may also include artificial<br />
s<strong>and</strong> deposits from locally-replenished beaches. Swamp <strong>and</strong> marsh<br />
deposits are composed of decaying marine grasses <strong>and</strong> vegetation<br />
with varying amounts of fine marine sediments. These older<br />
peat deposits are overlain by live marine <strong>and</strong> brackish wetl<strong>and</strong><br />
vegetation. Swamp <strong>and</strong> marsh deposits occur locally on barrier<br />
beaches where depressions intersect groundwater. Cranberry bogs<br />
exist locally in low-lying upl<strong>and</strong> areas. Artificial fill occurs along<br />
the shoreline (e.g., beneficial re-use of dredged materials on town<br />
beaches).<br />
7.4 <strong>Coastal</strong> Wetl<strong>and</strong> <strong>Resource</strong>s<br />
Several coastal wetl<strong>and</strong> resource areas, as defined by the<br />
Massachusetts Wetl<strong>and</strong>s Protection Act (MWPA) (M.G.L. c. 131,<br />
s. 40) <strong>and</strong> its Regulations (310 CMR 10.00), occur in <strong>Pleasant</strong> <strong>Bay</strong><br />
including: Salt Marsh, Barrier Beach, <strong>Coastal</strong> Beach, <strong>Coastal</strong> Dune, 7.4.2 Marine <strong>and</strong> Estuarine Wetl<strong>and</strong>s<br />
<strong>Coastal</strong> Bank, <strong>and</strong> other l<strong>and</strong>s subject to tidal flow (Map 10 <strong>and</strong> Marine <strong>and</strong> estuarine wetl<strong>and</strong>s include non-vegetated flats (tidal<br />
Table 3). The MWPA protects wetl<strong>and</strong>s <strong>and</strong> the public interests flats) <strong>and</strong> vegetated, tidal wetl<strong>and</strong>s. Non-vegetated flats are<br />
they serve, including flood control, prevention of pollution composed of various combinations of s<strong>and</strong>, silt <strong>and</strong> clay (Tiner,<br />
<strong>and</strong> storm damage, <strong>and</strong> protection of public <strong>and</strong> private 2010). Some flats are colonized by algae, while shallow estuarine<br />
water supplies, groundwater supply, fisheries, l<strong>and</strong> containing waters in the <strong>Bay</strong> support extensive beds of eelgrass. Tidal wetl<strong>and</strong>s<br />
shellfish, <strong>and</strong> wildlife habitat. For example, <strong>Coastal</strong> Beach is include salt marshes <strong>and</strong> brackish marshes, which are salinity<br />
significant to the interests of storm damage prevention, flood dependent. Salt marshes develop closest to the ocean where<br />
control, <strong>and</strong> the protection of wildlife. Salt Marshes are also salinities are highest, while brackish marshes form along tidal rivers<br />
significant to the protection of storm damage prevention <strong>and</strong> <strong>and</strong> streams where salt water is significantly diluted by fresh water.<br />
wildlife habitat, but also to the protection of marine fisheries,<br />
shellfish, the prevention of pollution, <strong>and</strong> groundwater supply.<br />
These public interests are protected by requiring a careful<br />
review of proposed work that may alter these wetl<strong>and</strong>s. The 24<br />
<strong>Pleasant</strong> <strong>Bay</strong> Alliance 2011<br />
law protects not only wetl<strong>and</strong>s, but other coastal resource<br />
areas, such as L<strong>and</strong> Subject to <strong>Coastal</strong> Storm Flowage (100-year<br />
coastal floodplain), the Riverfront Area (Rivers Protection Act),<br />
<strong>and</strong> L<strong>and</strong> Under Salt Ponds, L<strong>and</strong> Under the Ocean, <strong>and</strong> fish<br />
runs. Several tidal or salt ponds exist in the study area, including<br />
Round Cove in Harwich, Crows Pond in <strong>Chatham</strong>, <strong>and</strong> Quanset<br />
Pond, Arey’s Pond, <strong>and</strong> Kescayogansett (Lonnie’s) Pond in Orleans.<br />
Freshwater wetl<strong>and</strong>s <strong>and</strong> water bodies that outflow into <strong>Pleasant</strong><br />
<strong>Bay</strong>, as well as isolated wetl<strong>and</strong>s located on coastal l<strong>and</strong>forms<br />
(Nauset Beach), also occur within the study area. These include<br />
hydrologically-connected lakes <strong>and</strong> ponds <strong>and</strong> their bordering<br />
freshwater wetl<strong>and</strong>s, vernal pools, bogs, shrub swamps, wooded<br />
swamps, <strong>and</strong> freshwater seeps. These wetl<strong>and</strong>s are similarly<br />
protected by the MWPA <strong>and</strong> its regulations under several wetl<strong>and</strong><br />
resource area types: Bordering Vegetated Wetl<strong>and</strong>s, Bank, L<strong>and</strong><br />
Under Water Bodies <strong>and</strong> Waterways, L<strong>and</strong> Subject to Flooding, <strong>and</strong><br />
Riverfront Area.<br />
Activities within the above wetl<strong>and</strong> resource areas are also strictly<br />
regulated by local <strong>and</strong> federal wetl<strong>and</strong> protection laws <strong>and</strong><br />
regulations. Activities undertaken within 100 feet of wetl<strong>and</strong>s<br />
located within the state-designated ACEC are subject to the higher<br />
st<strong>and</strong>ard of “no adverse effect.” Local wetl<strong>and</strong> bylaws for towns<br />
bordering the <strong>Bay</strong> may extend wetl<strong>and</strong> protections further than<br />
state or federal regulations.<br />
7.4.1 Beaches, Dunes <strong>and</strong> <strong>Coastal</strong> Banks<br />
Nauset Beach, the most prominent coastal l<strong>and</strong>form in the <strong>Pleasant</strong><br />
<strong>Bay</strong> area, is a barrier beach consisting of coastal beach <strong>and</strong> extensive<br />
coastal dune resource areas. Smaller barrier beaches exist elsewhere<br />
around the <strong>Bay</strong>, extending downdrift of headl<strong>and</strong>s (e.g., Strong<br />
Isl<strong>and</strong>) <strong>and</strong> protecting small coves <strong>and</strong> marshes. <strong>Coastal</strong> beaches<br />
backed by coastal banks composed of glacial sediments (<strong>and</strong><br />
sometimes associated with small, linear dunes or fringing salt marsh)<br />
form much of the shoreline on the western side of the <strong>Bay</strong>. Where<br />
coastal banks are actively eroding, they provide sediment to the<br />
coastal system, allowing beaches, marshes <strong>and</strong> flats to accrete <strong>and</strong><br />
keep pace with ongoing sea-level rise. Eroding banks also provide<br />
nesting sites for some bird species (e.g., bank swallow, belted<br />
kingfisher). Where coastal structures such as seawalls or revetments<br />
exist, beach <strong>and</strong> dune environments are typically narrower unless<br />
the shore has been re-nourished.
<strong>Coastal</strong> <strong>Resource</strong> <strong>Guide</strong> for <strong>Pleasant</strong> <strong>Bay</strong> <strong>and</strong> <strong>Chatham</strong> <strong>Harbor</strong><br />
Table 3. <strong>Coastal</strong> Wetl<strong>and</strong> <strong>Resource</strong> Areas <strong>and</strong> Freshwater Wetl<strong>and</strong>s in the <strong>Pleasant</strong> <strong>Bay</strong> Study Area<br />
Wetl<strong>and</strong><br />
<strong>Resource</strong> Type<br />
Acreage<br />
(2007) Interests Protected by Wetl<strong>and</strong> <strong>Resource</strong> Type<br />
<strong>Coastal</strong> Bank 96 Storm damage prevention, flood control<br />
<strong>Coastal</strong> Beach 113 Storm damage prevention, flood control, wildlife habitat<br />
<strong>Coastal</strong> Dune 85<br />
Rocky Intertidal Shore 1 Storm damage prevention, flood control, marine fisheries, wildlife habitat, shellfish<br />
Salt Marsh<br />
1,391 Marine fisheries, wildlife habitat, shellfish, prevention of pollution, storm damage prevention,<br />
groundwater supply<br />
Tidal flat 225 Marine fisheries, wildlife habitat, shellfish<br />
Barrier Beach System 41 Storm damage prevention, flood control, wildlife habitat, marine fisheries, wildlife habitat,<br />
shellfish<br />
Barrier Beach-<strong>Coastal</strong> Beach 259<br />
Barrier Beach-<strong>Coastal</strong> Dune 650<br />
Wooded swamp – deciduous trees 116 Public/private water supply, groundwater supply, flood control, storm damage prevention,<br />
Wooded swamp – coniferous trees 38 pollution prevention, fisheries, <strong>and</strong> wildlife habitat. (Interests served by Bordering Vegetated<br />
Wooded swamp – mixed trees 41 Wetl<strong>and</strong>s, which includes wet meadows, marshes, swamps <strong>and</strong> bogs.)<br />
Shrub swamp 264<br />
Shallow marsh, meadow or fen 48<br />
Deep marsh 20<br />
Cranberry bog 59<br />
Bog 4<br />
25<br />
Salt Marshes<br />
Approximately 1,400 acres of salt marsh occur in <strong>Pleasant</strong> <strong>Bay</strong>,<br />
making these the most abundant <strong>and</strong> widespread coastal wetl<strong>and</strong><br />
resource areas in the Atlas area. Hundreds of acres of salt marsh<br />
border the l<strong>and</strong>ward margin of the Nauset barrier, with the most<br />
extensive marshes occurring in Little <strong>Pleasant</strong> <strong>Bay</strong> in the vicinity of<br />
Pochet, Sampson, <strong>and</strong> Hog Isl<strong>and</strong>s. Large areas of salt marsh also<br />
border the tidal creek between Pochet Isl<strong>and</strong> <strong>and</strong> Pochet Neck <strong>and</strong><br />
occur adjacent to Strong Isl<strong>and</strong> <strong>and</strong> just east of Little Sipson Isl<strong>and</strong><br />
in <strong>Pleasant</strong> <strong>Bay</strong> (Sipson Meadow). Salt marshes are common in<br />
small, protected inlets along the shore <strong>and</strong> fringe the edge of the<br />
<strong>Bay</strong> in low energy settings. Just over half of the 45-mile mainl<strong>and</strong><br />
bay shoreline (i.e., not including the back-barrier margin of Nauset<br />
Beach <strong>and</strong> North Beach Isl<strong>and</strong>) is fringed by salt marsh (Borrelli,<br />
2009). The comparatively smaller amount of fringing salt marsh<br />
along the mainl<strong>and</strong> shore of <strong>Chatham</strong> <strong>Harbor</strong> may be due to its<br />
more dynamic nature given its proximity to the 1987 <strong>and</strong> 2007<br />
inlets. A recent study of shoreline change in the <strong>Bay</strong> from 1868<br />
to 2005 using the marsh edge as a proxy for determining rates of<br />
shoreline change found that the seaward margin of salt marsh is<br />
eroding around much of the <strong>Bay</strong> (See Section 2.3.3). Marsh edge<br />
accretion was documented only on the isl<strong>and</strong>s <strong>and</strong> along the bay<br />
side of Nauset Beach due to salt marsh development on washover<br />
fans <strong>and</strong> subtidal shoals.<br />
Salt marshes are highly productive coastal wetl<strong>and</strong>s dominated by<br />
Spartina grasses that are comprised of three distinct zones: low<br />
marsh, high marsh, <strong>and</strong> the marsh border (Carlisle et al, 2002).<br />
Low marsh forms the seaward edge of the salt marsh <strong>and</strong> is usually<br />
flooded during every high tide <strong>and</strong> exposed at low tide. Smooth<br />
cordgrass (Spartina alterniflora), a tall salt-tolerant grass species,<br />
Salt marsh at Jackknife L<strong>and</strong>ing in <strong>Chatham</strong>. Photo Credit: Carole Ridley<br />
is the dominant plant growing in the low marsh. High marsh lies<br />
between the low marsh <strong>and</strong> marsh border, <strong>and</strong> is generally flooded<br />
only during higher than average tides. Salt meadow hay (Spartina<br />
patens), spike grass (Distichlis spicata), <strong>and</strong> black grass (Juncus<br />
gerardii) are the most common plant species comprising the high<br />
marsh. A short form of smooth cordgrass may also be common in<br />
this zone. Depressions, or pannes, in the high marsh hold water<br />
for extended periods, creating highly saline conditions that only<br />
the most salt tolerant plant species can withst<strong>and</strong>. High marsh<br />
occurs primarily in the upper sections of the <strong>Bay</strong> where areas of salt<br />
marsh are more extensive, while fringing marshes along the lower<br />
bay shoreline is typically low marsh. Large areas of high marsh in<br />
the <strong>Bay</strong> were converted to low marsh between 1984 <strong>and</strong> 2000<br />
due to changes in tidal amplitude caused by inlet breaching <strong>and</strong><br />
migration (Smith, 2009). However, there have been no net changes<br />
in marsh area within the <strong>Bay</strong>, <strong>and</strong> evidence of marsh dieback (e.g.,<br />
due to crab herbivory) has not been found. High marsh comprises<br />
a relatively small amount of the overall area of salt marsh in the <strong>Bay</strong><br />
(approximately 10%), with most of the remaining salt marsh around<br />
the <strong>Bay</strong> being low marsh (Smith, 2010, Pers. Comm., 27 April).<br />
<strong>Pleasant</strong> <strong>Bay</strong> Alliance 2011
<strong>Coastal</strong> <strong>Resource</strong> <strong>Guide</strong> for <strong>Pleasant</strong> <strong>Bay</strong> <strong>and</strong> <strong>Chatham</strong> <strong>Harbor</strong><br />
The marsh border along the upper edge of the salt marsh is only<br />
flooded during extreme astronomical tides or storm surges. A<br />
higher diversity of plants grows in this part of the marsh, including<br />
both herbaceous <strong>and</strong> woody plants such as high tide bush (Iva<br />
frutescens), seaside goldenrod (Solidago sempervirens), <strong>and</strong> switch<br />
grass (Panicum virgatum). Plants adapted to brackish conditions<br />
occur along the upper reaches of salt marshes <strong>and</strong> border tidal<br />
rivers <strong>and</strong> streams that discharge to the <strong>Bay</strong>.<br />
Tidal Flats<br />
Although salt marsh is the most abundant intertidal habitat type<br />
in the <strong>Bay</strong>, other unvegetated intertidal environments (tidal flats)<br />
also exist including s<strong>and</strong> flat, mud flat, <strong>and</strong> cobble/pebble flats.<br />
Tidal flats reach their greatest extent in the upper reaches of the<br />
<strong>Bay</strong> between Sampson <strong>and</strong> Pochet Isl<strong>and</strong>s, <strong>and</strong> in the tidal inlet<br />
between Pochet Isl<strong>and</strong> <strong>and</strong> Pochet Neck. Extensive tidal flats also<br />
occur south of Strong Isl<strong>and</strong>, in <strong>Chatham</strong> <strong>Harbor</strong> in the vicinity<br />
of Tern Isl<strong>and</strong>, <strong>and</strong> bordering some sections of the bay shore of<br />
Nauset Beach. The grain size composition of tidal flats is controlled<br />
primarily by the velocity of tidal currents. Mudflats develop in<br />
lower energy settings such as small, protected coves in the upper<br />
bay, while s<strong>and</strong> flats occur in areas of high tidal current velocity<br />
near barrier beach inlets <strong>and</strong> channels. The net transport of s<strong>and</strong><br />
grains on a s<strong>and</strong> flat in any one direction is small because of the<br />
oscillatory nature of the tidal currents.<br />
The salt marshes <strong>and</strong> tidal flats in several parts of the <strong>Bay</strong> were<br />
identified in the <strong>Pleasant</strong> <strong>Bay</strong> <strong>Resource</strong> Management Plan as Areas<br />
of Critical Marine Habitat based on their significant habitat values<br />
(e.g., feeding <strong>and</strong> roosting areas for coastal waterbirds, habitat<br />
for horseshoe crabs, diamondback terrapin, etc.) These areas<br />
(numbers correspond to areas shown on Map 11) include:<br />
#1<br />
• The intertidal zone <strong>and</strong> tidal flats north of Tern Isl<strong>and</strong>, south of<br />
Minister’s Point, <strong>and</strong> west of the channel.<br />
#2<br />
• The intertidal zone <strong>and</strong> tidal flats surrounding the east, west<br />
<strong>and</strong> south sides of Strong Isl<strong>and</strong>.<br />
• The intertidal area of Nickerson’s Neck from the Strong Isl<strong>and</strong><br />
town l<strong>and</strong>ing to the southeastern tip of Fox Hill <strong>and</strong> from the<br />
<strong>Chatham</strong> Yacht Club north to the 7 th tee of the Eastward Ho!<br />
Country Club.<br />
• The intertidal zone <strong>and</strong> flats west of Nauset Beach from the<br />
2007 inlet north to Broad Creek <strong>and</strong> Hog Isl<strong>and</strong> Creek, <strong>and</strong> the<br />
south side of Hog Isl<strong>and</strong> <strong>and</strong> the west side of Sampson Isl<strong>and</strong> to<br />
its northern tip.<br />
• The intertidal zone from the southwest end of the Narrows (just<br />
northwest of Sipson Isl<strong>and</strong>) to the eastern end of the Winslow<br />
revetment, <strong>and</strong> the intertidal zone <strong>and</strong> flats surrounding Little<br />
Sipson Isl<strong>and</strong>.<br />
• The intertidal zone along south shore of Barley Neck.<br />
Submerged eelgrass in <strong>Pleasant</strong> <strong>Bay</strong>. Photo: Cape Cod Cooperative<br />
Extension/Woods Hole Sea Grant<br />
#3<br />
• The intertidal zone from in Little <strong>Pleasant</strong> <strong>Bay</strong> from Namequoit<br />
Point west to the entrance of Pah Wah Pond.<br />
• The intertidal zone from the conservation property on the south<br />
side of Kent’s Point, <strong>and</strong> along both sides of The River to Meet<br />
inghouse Pond (including Frost Fish Cove).<br />
Eelgrass Beds<br />
Eelgrass beds are highly productive, subtidal plant communities<br />
that provide nursery <strong>and</strong>/or feeding habitat for many fish,<br />
waterfowl <strong>and</strong> invertebrate species (Costa, undated). Loss of<br />
eelgrass can result in significant shifts in marine fauna, including<br />
commercial <strong>and</strong> recreational species. The degradation of eelgrass<br />
beds in the 1930s from an outbreak of wasting disease caused<br />
bay scallop stocks to crash <strong>and</strong> brant geese population numbers<br />
to plummet. Because eelgrass grows underwater, these important<br />
habitats often go unnoticed except by boaters, shellfishermen,<br />
<strong>and</strong> divers. Eelgrass is highly sensitive to pollution (e.g., nitrogen<br />
loading) <strong>and</strong> serves as an ideal indicator of water quality changes.<br />
Over 1,800 acres of eelgrass occurs in <strong>Pleasant</strong> <strong>Bay</strong>, reflecting the<br />
high habitat <strong>and</strong> water quality of areas within the <strong>Bay</strong> (Howes,<br />
et al 2006). Map 12 shows the distribution of eelgrass mapped<br />
during 1995 <strong>and</strong> 2001 surveys. 1 The most extensive eelgrass beds<br />
are located in Little <strong>Pleasant</strong> <strong>Bay</strong>, the central section of <strong>Pleasant</strong><br />
<strong>Bay</strong> around Sipson Isl<strong>and</strong> <strong>and</strong> west of Strong Isl<strong>and</strong>. Eelgrass beds<br />
also exist in the tidal creek between Sampson Isl<strong>and</strong> <strong>and</strong> Barley<br />
Neck. Significant eelgrass habitat also exists in Bassing <strong>Harbor</strong> <strong>and</strong><br />
the tidal river between Barley Neck <strong>and</strong> Pochet Isl<strong>and</strong> (although<br />
some eelgrass in these areas was mapped only during the 1995<br />
survey). Smaller patches of eelgrass are scattered in the shallow<br />
subtidal zone west of the Nauset Barrier Beach. Eelgrass coverage<br />
in the <strong>Bay</strong> has declined by approximately 24% over the last half<br />
century (except <strong>Chatham</strong> <strong>Harbor</strong>) <strong>and</strong> the density of eelgrass in<br />
existing beds may be thinning (Howes et al, 2006). Anecdotally,<br />
the health eelgrass beds appear to be increasing in Little <strong>Pleasant</strong><br />
<strong>Bay</strong>, possibly due to improved water quality (Farber, 2010, Pers.<br />
Comm., 7 February). However, the system-wide eelgrass decline in<br />
the <strong>Bay</strong> is linked to environmental changes associated with nutrient<br />
enrichment (Howes et al, 2006).<br />
1 Eelgrass mapped during the 1995 survey but not during the 2001 survey may have disappeared, or may not have occurred in sufficient density to be mapped.<br />
26<br />
<strong>Pleasant</strong> <strong>Bay</strong> Alliance 2011
27<br />
7.4.3 Freshwater Wetl<strong>and</strong>s<br />
Freshwater, or palustrine, wetl<strong>and</strong>s are characterized by trees,<br />
shrubs <strong>and</strong> persistent herbaceous plants, <strong>and</strong> include marshes,<br />
swamps, bogs <strong>and</strong> shallow open water bodies (ponds). The<br />
boundary of the <strong>Pleasant</strong> <strong>Bay</strong> ACEC includes eleven freshwater<br />
ponds, each of which has a perennial hydrological connection to<br />
the <strong>Bay</strong>. Examples include Crystal Lake, Pilgrim Lake, <strong>and</strong> Little<br />
Quanset Pond in Orleans, <strong>and</strong> Mill Pond, Stillwater Pond, <strong>and</strong> Fox<br />
Pond in <strong>Chatham</strong>. A 2003 study documented exemplary sites<br />
for state <strong>and</strong> globally rare habitat (New Engl<strong>and</strong> <strong>Coastal</strong> Plain<br />
Pond Shore Community <strong>and</strong> the Atlantic White Cedar Swamp<br />
Community) among the freshwater pond shores within the ACEC<br />
(Horsley & Witten, 2003). In addition, the study found occurrences<br />
of Plymouth gentian (Sabatia kennedyana) <strong>and</strong> slender arrowhead<br />
(Sagittaria teres) around pond shores, both of which are species of<br />
Special Concern. Shrub swamps, wooded swamps (e.g., red maple<br />
swamp), cranberry bogs, <strong>and</strong> other freshwater wetl<strong>and</strong> types<br />
border water bodies <strong>and</strong> waterways that discharge into the <strong>Bay</strong>.<br />
A good example of these varied wetl<strong>and</strong> types exists along Muddy<br />
Creek. Dune swale wetl<strong>and</strong>s occur in depressions between s<strong>and</strong><br />
dunes where the s<strong>and</strong>y soils are waterlogged due to seasonal high<br />
water tables. Although scattered <strong>and</strong> relatively few in number,<br />
interdunal wetl<strong>and</strong>s are best developed on Nauset Beach. Marshes<br />
<strong>and</strong> shrub swamps are the most common wetl<strong>and</strong> types in the<br />
dune swales on Nauset Beach.<br />
7.5 Fish <strong>and</strong> Wildlife<br />
<strong>Pleasant</strong> <strong>Bay</strong>’s diverse coastal environments provide habitat for a<br />
remarkable array of fish <strong>and</strong> wildlife species. Contributing to the<br />
<strong>Bay</strong>’s biodiversity is its location near the intersection of two major<br />
biogeographic ocean regions, the Acadian <strong>and</strong> Virginian provinces,<br />
which are distinguished by marked differences in physical<br />
characteristics, biological communities, <strong>and</strong> weather patterns.<br />
Resident <strong>and</strong> migratory species of finfish, shellfish, birds, reptiles,<br />
<strong>and</strong> mammals find feeding, resting, breeding, <strong>and</strong> nursery habitat<br />
in or around the <strong>Bay</strong>. Sensitive wildlife <strong>and</strong> wildlife habitats within<br />
the coastal zone include: shorebirds, seal haul-out sites, horseshoe<br />
crabs, anadromous fish runs, shellfish, <strong>and</strong> rare wildlife species<br />
(Maps 13 <strong>and</strong> 14).<br />
7.5.1 Birds<br />
<strong>Pleasant</strong> <strong>Bay</strong> provides habitat for a variety of migratory <strong>and</strong> yearround<br />
shorebirds, coastal waterbirds, waterfowl, raptors, <strong>and</strong><br />
songbirds, including several state <strong>and</strong> federally-listed rare species<br />
(Map 13 <strong>and</strong> 14). Common eiders, black ducks, brant <strong>and</strong> other<br />
waterfowl gather in large numbers in the relatively sheltered<br />
waters of the <strong>Bay</strong>, especially during the winter. Sea ducks, such as<br />
common eiders <strong>and</strong> scoters, typically gather in greatest numbers<br />
in <strong>Chatham</strong> <strong>Harbor</strong> during this time of year. Snowy owls <strong>and</strong> two<br />
state-listed rare bird species, short-eared owl <strong>and</strong> Northern harrier,<br />
use habitats on Nauset Beach during the winter.<br />
During the spring <strong>and</strong> summer, rare species such as piping plovers<br />
<strong>and</strong> common <strong>and</strong> least terns nest on Nauset Beach <strong>and</strong> North<br />
Beach Isl<strong>and</strong>. Piping plovers nest on the uppermost beach while<br />
terns favor sparsely vegetated or unvegetated, s<strong>and</strong>y or gravelly<br />
areas for nesting. As the name suggests, least terns are the most<br />
common nesting shorebird on Tern Isl<strong>and</strong>. Other bird species that<br />
<strong>Coastal</strong> <strong>Resource</strong> <strong>Guide</strong> for <strong>Pleasant</strong> <strong>Bay</strong> <strong>and</strong> <strong>Chatham</strong> <strong>Harbor</strong><br />
Seals are increasingly common in <strong>Pleasant</strong> <strong>Bay</strong> <strong>and</strong> <strong>Chatham</strong> <strong>Harbor</strong>.<br />
Photo: Robert Prescott.<br />
nest in the area include American oystercatcher, which nests near<br />
dunes or the marsh edge on Monomoy <strong>and</strong> possibly on Nauset<br />
Beach, <strong>and</strong> willets, which often nest on edge of the salt marsh.<br />
Extensive areas of high salt marsh in Little <strong>Pleasant</strong> <strong>Bay</strong> provide<br />
nesting habitat for salt marsh sharp-tailed sparrows. Belted<br />
kingfishers nest in eroding coastal banks on Sipson Isl<strong>and</strong>.<br />
Shorebirds, such as terns, feed in the <strong>Bay</strong>, tidal inlets, <strong>and</strong> shallow,<br />
coastal waters, while overwash fans (unvegetated expanses of<br />
s<strong>and</strong> deposited by storm waves on the bayside of barrier beaches)<br />
provide optimal high tide roosting <strong>and</strong> loafing sites. The Little<br />
Sipson Isl<strong>and</strong> flats are rich with invertebrates (e.g., marine worms,<br />
crustaceans, etc.) <strong>and</strong> are important feeding habitat for migratory<br />
<strong>and</strong> nesting shorebirds, including red knot, short-billed dowitcher,<br />
<strong>and</strong> Hudsonian godwit. At high tide, shorebirds fly to roosts such<br />
as Little Sipson Isl<strong>and</strong>, North Beach Isl<strong>and</strong>, Tern Isl<strong>and</strong>, <strong>and</strong> Strong<br />
Isl<strong>and</strong>. Many more shorebirds use the South Beach-Monomoy<br />
complex to rest. Although only green herons nest on isl<strong>and</strong>s in the<br />
Atlas area, the isl<strong>and</strong>s provide important roost sites for great blue<br />
herons.<br />
7.5.2 Seal Haul-out Sites<br />
The populations of gray seals <strong>and</strong> harbor seals are increasing<br />
in the Cape Cod region. <strong>Harbor</strong> seals are generally seasonal<br />
residents <strong>and</strong> migrate north to breed in the summer. Gray seals<br />
are now year-round residents on the Cape. The 2007 breach<br />
of the barrier beach in <strong>Chatham</strong> has afforded seals another<br />
entryway into <strong>Pleasant</strong> <strong>Bay</strong> <strong>and</strong> <strong>Chatham</strong> <strong>Harbor</strong>. While the <strong>Bay</strong><br />
attracts seals because of its good water quality <strong>and</strong> abundant<br />
fish, the overall numbers of seals in the study area are much<br />
lower than populations elsewhere in the region (e.g., Monomoy<br />
Isl<strong>and</strong>, Muskeget Isl<strong>and</strong>). Seals currently use the flats south of<br />
Tern Isl<strong>and</strong> <strong>and</strong> the southern tip of North Beach Isl<strong>and</strong> as haulout<br />
sites (Map 13). Both gray seals <strong>and</strong> harbor seals use these<br />
haul-out sites in winter, while only gray seals use the sites during<br />
the summer (Prescott, 2003, Pers. Comm., 18 April). Seals may<br />
use other locations in the <strong>Bay</strong> as seasonal haul-outs, such as<br />
ephemeral shoals near the inlets that form <strong>and</strong> disappear <strong>and</strong><br />
other areas where fish are concentrated (e.g., near fish runs). The<br />
increasing presence of gray seals year-round has attracted great<br />
white sharks in recent years, a chief predator of this species in the<br />
western Atlantic Ocean. Shark sightings have been documented in<br />
<strong>Chatham</strong> <strong>Harbor</strong> on an infrequent basis.<br />
<strong>Pleasant</strong> <strong>Bay</strong> Alliance 2011
<strong>Coastal</strong> <strong>Resource</strong> <strong>Guide</strong> for <strong>Pleasant</strong> <strong>Bay</strong> <strong>and</strong> <strong>Chatham</strong> <strong>Harbor</strong><br />
The Atlantic “blue-eyed”<br />
scallop. Photo: Cape Cod<br />
Cooperative Extension/<br />
Woods Hole Sea Grant<br />
7.5.3 Anadromous Fish Runs<br />
Fish runs provide passage for anadromous fishes (e.g., blueback<br />
herring, alewife) between freshwater spawning sites <strong>and</strong> the ocean<br />
where adult fish spend their lives. Active anadromous fish runs<br />
in <strong>Pleasant</strong> <strong>Bay</strong> currently exist between Kescayogansett (Lonnie’s)<br />
Pond <strong>and</strong> Pilgrim Pond, <strong>and</strong> between Ryder’s Cove. Stillwater Pond<br />
<strong>and</strong> Lovers Lake (Map 13). Muddy Creek dividing <strong>Chatham</strong> <strong>and</strong><br />
Harwich provides habitat for some catadramous fish such as<br />
American eel.<br />
7.5.4 Shellfish <strong>and</strong> Horseshoe Crabs<br />
<strong>Pleasant</strong> <strong>Bay</strong> supports a variety of commercially important shellfish<br />
species, including quahogs, scallops <strong>and</strong> oysters. Areas of the<br />
<strong>Bay</strong> identified as suitable habitat for specific shellfish species are<br />
shown on Map 15. 2 Quahog <strong>and</strong> soft-shelled clam habitat occurs<br />
along the margins of large tidal creeks in upper Little <strong>Pleasant</strong><br />
<strong>Bay</strong>, shallow inlets <strong>and</strong> coves (Ryder’s Cove, Crows Pond), <strong>and</strong><br />
elsewhere along the shallow margins of <strong>Pleasant</strong> <strong>Bay</strong>. Quahog<br />
harvests have fallen considerably since the mid-1980s. Possible<br />
causes include increased <strong>Bay</strong> salinity due to inlet breaching (<strong>and</strong><br />
reduced freshwater flows), changes in allowable harvest size,<br />
<strong>and</strong> increase predator <strong>and</strong> pest populations. 3 Soft shell clam<br />
harvests, on the other h<strong>and</strong>, have been rising since 2002. The<br />
increase in razor clam harvesting in the <strong>Bay</strong> over the last decade<br />
or so is possibly due to new harvesting techniques (“salting”) that<br />
are driven by increased market dem<strong>and</strong> for this species. Field<br />
observations have found an abundance of razor clam <strong>and</strong> soft-shell<br />
clam larvae in bay waters sufficient to sustain a relatively large<br />
harvest. Habitat for blue mussels is located along the shallow bay<br />
shore margin of Nauset Beach in the vicinity of the 2007 inlet <strong>and</strong><br />
just south of Tern Isl<strong>and</strong>.<br />
Although extensive areas of both <strong>Pleasant</strong> <strong>Bay</strong> <strong>and</strong> Little <strong>Pleasant</strong><br />
<strong>Bay</strong> are mapped as habitat for bay scallop, the local scallop harvest<br />
has been almost non-existent since the productive harvests in 1983<br />
<strong>and</strong> 1984. The reasons for the dramatic decline in scallop over the<br />
last two decades are unknown, though water quality degradation<br />
<strong>and</strong> the continued loss of eelgrass in the <strong>Bay</strong> are possible<br />
contributors. In contrast, the local scallop harvest in 2009 was very<br />
good (Farber, Murphy, Moore, 2010, Pers. Comm.). Improvement<br />
in bay water quality following the inlet breach in 2007 may have<br />
benefited the local scallop fishery, but increased populations<br />
throughout the northeast suggest other, more regional causes for<br />
the rebound.<br />
Eighteen private aquaculture grants currently exist in <strong>Pleasant</strong> <strong>Bay</strong>,<br />
all in the Town of Orleans. Oysters <strong>and</strong> quahogs are the primary<br />
shellfish species being cultivated in the grant areas. Aquaculture<br />
benefits the <strong>Bay</strong> in several ways, including enhancing spawning<br />
shellfish numbers, increasing overall shellfish productivity on<br />
previously unproductive flats, attenuating pollution (nitrogen) in<br />
the <strong>Bay</strong>, <strong>and</strong> providing habitat (i.e., the shellfish gear) for juvenile<br />
fish <strong>and</strong> crustaceans. Aquaculture also generates local economic<br />
activity.<br />
Horseshoe crabs, long considered to a threat to shellfish<br />
populations, are now recognized as a commercially <strong>and</strong> ecologically<br />
important species. <strong>Pleasant</strong> <strong>Bay</strong> supports a significant population<br />
of actively spawning adult horseshoe crabs <strong>and</strong> provides<br />
substantial feeding <strong>and</strong> nursery grounds for them (Carmichael<br />
et al, 2003). The horseshoe crab spawning season on Cape Cod<br />
extends from May to June, with spawning occurring on s<strong>and</strong>y,<br />
low energy estuarine beaches. The Little Sipson Isl<strong>and</strong> flats are an<br />
important horseshoe crab spawning site as are s<strong>and</strong> flats east <strong>and</strong><br />
south of Hog <strong>and</strong> Sampson Isl<strong>and</strong>s <strong>and</strong> overwash fans along the<br />
bayside of Nauset Beach (e.g., near Pochet Isl<strong>and</strong>). These sites in<br />
<strong>Pleasant</strong> <strong>Bay</strong>, along with Monomoy Isl<strong>and</strong>, have been identified<br />
as spawning hot spots on Cape Cod, <strong>and</strong> may be responsible for<br />
the majority of the spawning that occurs on this part of the Cape.<br />
Following hatching, larvae <strong>and</strong> juveniles remain in the intertidal<br />
flats <strong>and</strong> subtidal areas near the breeding beaches (Smith et al,<br />
2009). The general migratory pattern of horseshoe crabs is thought<br />
to involve juveniles moving to deeper waters as they mature, <strong>and</strong><br />
reaching sexual maturity either in the estuary or migrating further<br />
to mature in the ocean. Adults migrate annually from the ocean or<br />
deep bay waters to spawn on estuarine beaches. Some adults may<br />
overwinter in embayments.<br />
Conservation <strong>and</strong> management of this species is controversial<br />
since they are harvested for biomedical, scientific, <strong>and</strong> bait<br />
purposes. Concern about horseshoe crabs increased in the late<br />
1990s because of the increased harvest <strong>and</strong> the heightened<br />
awareness of the critical ecological relationship between this<br />
species <strong>and</strong> migratory shorebirds in Delaware <strong>Bay</strong> (many shorebirds<br />
feed almost exclusively on horseshoe crab eggs). It is not known<br />
how many shorebirds on Cape Cod use horseshoe crab eggs<br />
as a food resource, although migrating shorebirds stopping at<br />
Monomoy Isl<strong>and</strong> are known to consume them (James-Pirri et al,<br />
2007). The total <strong>Pleasant</strong> <strong>Bay</strong> harvest in 2001 accounted for the<br />
mortality of ~1-2% of the adult population, with the biomedical<br />
harvest causing the great loss of horseshoe crabs since many<br />
more crabs were harvested for this purpose than for other uses<br />
(Rutecki et al, 2004). Harvest moratoriums in the Delaware <strong>Bay</strong><br />
states triggered increased harvesting elsewhere, including Cape<br />
Cod. In response to increased l<strong>and</strong>ings on Cape Cod, the Cape<br />
Cod National Seashore prohibited harvesting of horseshoe crabs<br />
within their jurisdiction. The remaining waters on the Cape under<br />
state Division of Marine Fisheries jurisdiction are also closed to any<br />
2 Note: these areas include sites where shellfish have been recorded but may not currently support any shellfish; therefore, these maps represent potential habitat. Also,<br />
because of changing sediment <strong>and</strong> water quality conditions, areas supporting shellfish may exist in areas not identified on MassGIS maps.<br />
3 Quahog Parasite Unknown (QPX) is also a significant concern among shellfish managers but has only been observed in selected private grant areas in the northern<br />
portion of the <strong>Bay</strong>.<br />
28<br />
<strong>Pleasant</strong> <strong>Bay</strong> Alliance 2011
<strong>Coastal</strong> <strong>Resource</strong> <strong>Guide</strong> for <strong>Pleasant</strong> <strong>Bay</strong> <strong>and</strong> <strong>Chatham</strong> <strong>Harbor</strong><br />
<strong>and</strong> the Isl<strong>and</strong>s harbor most of the state’s remaining nesting<br />
populations. Harriers may nest on Nauset Beach. Harriers hunt<br />
along the bayside of Nauset Beach during winter.<br />
Atlantic horseshoe crabs, Limulus polyphemus. Photo: Ben Carroll<br />
harvest with the exception of a permit issued to a single harvester<br />
for biomedical purposes (Moore, 2010, Pers. Comm.).<br />
7.5.5 Rare Species <strong>and</strong> Priority Natural Community<br />
Types<br />
Both priority rare species habitat <strong>and</strong> estimated rare species<br />
habitat are found throughout the entire study area (Map<br />
16). 4 Many rare (state <strong>and</strong>/or federally listed) plant <strong>and</strong> animal<br />
species have been documented in the study area. Rare species<br />
known to occur in <strong>Pleasant</strong> <strong>Bay</strong> include one Endangered species<br />
(Roseate Tern), three Threatened species (Piping Plover, Northern<br />
Harrier, <strong>and</strong> Diamondback Terrapin), <strong>and</strong> three Special Concern<br />
species (Least Tern, Common Tern, <strong>and</strong> Arctic Tern). Rare species<br />
including plants, dragonflies/ damselflies, reptiles, <strong>and</strong> moths are<br />
also associated with freshwater wetl<strong>and</strong>s in the study area. Two<br />
rare coastal plain pondshore plants, Plymouth gentian (Sabatia<br />
kennedyana) <strong>and</strong> slender arrowhead (Sagittaria teres), have been<br />
documented on freshwater ponds within the <strong>Pleasant</strong> <strong>Bay</strong> ACEC<br />
(Horsley & Witten, 2003). Both of these plants are classified by the<br />
Massachusetts Natural Heritage <strong>and</strong> Endangered Species Program<br />
(NHESP) as Species of Special Concern, <strong>and</strong> are found in muddy,<br />
s<strong>and</strong>y, or peaty soils in the shallow water margins of freshwater<br />
ponds.<br />
The following are brief profiles of each of the rare<br />
wildlife species found in the study area.<br />
Roseate Tern (Endangered) –<br />
disperse from breeding grounds<br />
in Buzzards <strong>Bay</strong> in mid to late<br />
August <strong>and</strong> concentrate in staging<br />
areas around Cape Cod, including<br />
South Beach <strong>and</strong> increasingly on<br />
North Beach Isl<strong>and</strong>. Feed almost<br />
exclusively on small fish. Depart for<br />
wintering grounds in September.<br />
RoseateTern. Photo: Ben Carroll<br />
Northern Harrier (Threatened) – establish nesting <strong>and</strong> feeding<br />
territories in wet meadows, grassl<strong>and</strong>s, <strong>and</strong> coastal <strong>and</strong> inl<strong>and</strong><br />
marshes. Prey on rodents, rabbits <strong>and</strong> other small mammals, small<br />
birds, insects, amphibians, etc. The breeding season of Northern<br />
harriers extends from March to July in Massachusetts. Cape Cod<br />
Piping Plover (Threatened)<br />
– arrive on nesting grounds<br />
in late March or April. Piping<br />
plovers nest on Nauset Beach,<br />
Tern Isl<strong>and</strong>, <strong>and</strong> South Beach,<br />
often building their nest<br />
between the high tide line <strong>and</strong><br />
the foot of the dunes. Young<br />
chicks leave their nests within<br />
hours of hatching <strong>and</strong> w<strong>and</strong>er<br />
hundreds of meters before<br />
they are capable of flight. Feed on mollusks, marine worms,<br />
crustaceans, <strong>and</strong> insects. Plovers migrate south between late July<br />
<strong>and</strong> early September, with occasional stragglers remaining until late<br />
October.<br />
Least Tern, Common Tern, Arctic Tern (Special Concern) –<br />
Common terns arrive in late April or early May, while Least terns<br />
arrive somewhat later (early May) <strong>and</strong> Arctic Terns later still (mid<br />
May). All species use s<strong>and</strong>y or gravelly areas with generally little<br />
or no vegetation on isl<strong>and</strong>s <strong>and</strong>/or barrier beaches for nesting<br />
(e.g., Nauset Beach, South Beach, Tern Isl<strong>and</strong>). Terns feed on<br />
small fish such as s<strong>and</strong> lance, herring, minnows, etc., but also feed<br />
on crustaceans <strong>and</strong> insects. Disturbance by humans <strong>and</strong> dogs,<br />
predators, <strong>and</strong> displacement by gulls are chronic management<br />
issues. Arctic terns leave as soon as their young can fly (early<br />
August) for its wintering grounds near the Antarctic Circle.<br />
Common terns depart from nesting sites in July <strong>and</strong> August, <strong>and</strong><br />
concentrate in “staging areas” around Cape Cod to feed before<br />
migrating south. Least terns depart by early September for their<br />
wintering grounds.<br />
Diamondback Terrapin<br />
(Threatened) – inhabit tidal<br />
marshes, mudflats, shallow<br />
bays, <strong>and</strong> coves, <strong>and</strong> nest in<br />
s<strong>and</strong>y upl<strong>and</strong>s on the bayside<br />
of Nauset Beach, near Sampson<br />
<strong>and</strong> Pochet Isl<strong>and</strong>s, <strong>and</strong> near<br />
the entrance to Meetinghouse<br />
Pond (Prescott, 2010). Terrapins<br />
Young Piping Plover (left).<br />
Photo: Andy Northrup<br />
Diamondback Terrapin, a<br />
threatened species. Photo:<br />
Richard Johnson<br />
overwinter in the bottom of estuaries, tidal creeks, <strong>and</strong> salt marsh<br />
channels. They feed on crabs, mollusks, crustaceans, fish, <strong>and</strong><br />
carrion. Threats include loss of s<strong>and</strong>y nesting habitats (dunes),<br />
recreational activity disrupting nesting turtles <strong>and</strong> hatchlings (e.g.,<br />
off-road vehicles), egg <strong>and</strong> hatchling predation, etc.<br />
29<br />
4 Priority Habitat is based on the known geographical extent of habitat for all state-listed rare species, both plants <strong>and</strong> animals. Habitat alteration within Priority Habitats<br />
is subject to regulatory review by NHESP. Estimated Habitats are a subset of Priority Habitats, <strong>and</strong> are based on the geographical extent of habitat of state-listed rare<br />
wetl<strong>and</strong>s wildlife only.<br />
5 Community state rank (SRANK) reflects the plant community’s rarity <strong>and</strong> threat within Massachusetts with regard to its regional rarity <strong>and</strong> threat. The SRANK S3 is<br />
defined as “typically 21-100 occurrences.<br />
<strong>Pleasant</strong> <strong>Bay</strong> Alliance 2011
<strong>Coastal</strong> <strong>Resource</strong> <strong>Guide</strong> for <strong>Pleasant</strong> <strong>Bay</strong> <strong>and</strong> <strong>Chatham</strong> <strong>Harbor</strong><br />
The approximately 300 acres of Saline/Brackish Flats in the central<br />
part of <strong>Pleasant</strong> <strong>Bay</strong> is the only priority natural community type<br />
identified by NHESP in the study area (Map 14). This priority<br />
community type, located between Sipson Isl<strong>and</strong> <strong>and</strong> Strong Isl<strong>and</strong>,<br />
has a community state rank of S3. 5 The Saline/Brackish Flats<br />
estuarine community type is a sparsely vegetated intertidal habitat<br />
found on mineral substrates. The flats are characterized by the<br />
NHESP as having an excellent diversity of marine fauna <strong>and</strong> algae<br />
in a variety of microhabitats. Horseshoe crabs are abundant here<br />
as are shorebirds during migration. As mentioned in Section 7.4.3<br />
(Freshwater Wetl<strong>and</strong>s), exemplary occurrences of the state <strong>and</strong><br />
globally rare New Engl<strong>and</strong> <strong>Coastal</strong> Plain Pond Shore Community<br />
(S2) <strong>and</strong> the Atlantic White Cedar Swamp Community (S2) have<br />
been documented among the freshwater ponds within the ACEC. 6<br />
7.6 Water Quality<br />
The <strong>Pleasant</strong> <strong>Bay</strong> Citizen Water Quality Monitoring Program has<br />
been monitoring water quality in the <strong>Bay</strong> since 2000 in order to<br />
obtain consistent <strong>and</strong> comprehensive data to gauge nutrient inputs<br />
from the watershed <strong>and</strong> other sources. Twenty stations were<br />
monitored in 2011, <strong>and</strong> the program will monitor that number for<br />
the foreseeable future. The water quality data collected is essential<br />
for trend analyses <strong>and</strong> is relied upon by the towns for development<br />
<strong>and</strong> compliance monitoring for wastewater management plans.<br />
declining at others (Table 4). However, most of the sites do not<br />
demonstrate any statistically significant trends. Sites showing<br />
improvement in water quality are typically located in open water<br />
areas of the <strong>Bay</strong>, while sites showing declining water quality<br />
tend to be located in the sub-embayments. Results of the baywide<br />
analysis indicate that water quality was declining for some<br />
parameters prior to the 2007 break in Nauset Beach, but that it<br />
has been improving for these same parameters since that time.<br />
Other parameters remain unchanged. The results suggest that the<br />
increased exchange of water between the <strong>Bay</strong> <strong>and</strong> ocean (due to<br />
2007 inlet formation) may be responsible for limited improvements<br />
in water quality in some open areas of the <strong>Bay</strong>. Even with limited<br />
improvement in these areas, bioactive nitrogen concentrations<br />
continue to exceed MEP-modeled restoration values for estuarine<br />
health. Furthermore, the anticipated continued southern migration<br />
of the 2007 inlet suggests that tidal flushing <strong>and</strong> nitrogen<br />
concentrations in the <strong>Bay</strong> may, over time, return to pre-inlet<br />
conditions.<br />
<br />
The Massachusetts Estuaries Project (MEP) used water quality<br />
data collected by the <strong>Pleasant</strong> <strong>Bay</strong> program to determine critical<br />
nitrogen loading thresholds. The MEP determined that in order<br />
to remain healthy enough to sustain eelgrass, waters in <strong>Pleasant</strong><br />
<strong>Bay</strong> would have a concentration of bioactive nitrogen not to<br />
exceed 0.21 mg/l (Howes et al, 2006). In 2007, the Massachusetts<br />
Department of Environmental Protection established TMDL’s (total<br />
maximum daily loads) for total nitrogen the <strong>Bay</strong>. The TMDLs<br />
represent the amount of nitrogen the <strong>Bay</strong> can receive <strong>and</strong> not<br />
exceed the threshold bioactive nitrogen concentration identified by<br />
the MEP (Massachusetts EOEA, 2007). A TMDL for total nitrogen<br />
was calculated for each of <strong>Pleasant</strong> <strong>Bay</strong>’s nineteen subembayments.<br />
The TMDL’s, which range from 2 to 155 kg/day, require reductions<br />
in current watershed nitrogen loads of up to 100% in certain<br />
subwatersheds. Because septic systems account for three quarters<br />
of the controllable watershed nitrogen load, several towns are<br />
pursuing comprehensive wastewater treatment to achieve targeted<br />
nitrogen reductions. Other nitrogen reduction strategies, such as<br />
minimizing loadings from stormwater runoff <strong>and</strong> fertilizer use, also<br />
are being explored but alone are not sufficient to achieve targeted<br />
nitrogen reductions.<br />
In an effort to better underst<strong>and</strong> water quality trends in <strong>Pleasant</strong><br />
<strong>Bay</strong>, statistical analysis was conducted on the 10 years of water<br />
quality data that have been collected (Cadmus, 2010). Statistical<br />
analysis of the data included a bay-wide trend analysis, as well as<br />
site-specific analyses. Analysis of the data also identify any effects<br />
of the new inlet (2007), with its concomitant increase in the rate<br />
<strong>and</strong> volume of water exchange between <strong>Pleasant</strong> <strong>Bay</strong> <strong>and</strong> the<br />
Atlantic Ocean, on trends in bay water quality.<br />
The results of the site-specific analysis of water quality trends<br />
demonstrate that water quality is improving at some sites, but<br />
30<br />
<strong>Pleasant</strong> <strong>Bay</strong> Alliance 2011
<strong>Coastal</strong> <strong>Resource</strong> <strong>Guide</strong> for <strong>Pleasant</strong> <strong>Bay</strong> <strong>and</strong> <strong>Chatham</strong> <strong>Harbor</strong><br />
Table 4 shows statistically significant water quality trends at individual stations.<br />
Green triangles represent improved water quality; red triangles indicate declining water quality; yellow squares indicate no statistically<br />
significant trend. Direction of triangles indicates direction of concentration. DO=dissolved oxygen; PO4 =phosphate; DIN=dissolved<br />
inorganic nitrogen; TN=total nitrogen; BioN=bioactive nitrogen. Note: half the stations do not have data after the 2007 break. Source: The<br />
Cadmus Group, 2010.<br />
Station DO PO4 DIN TN BioN Pigment Post Break Data<br />
<strong>Chatham</strong> <strong>Harbor</strong> (PBA-1) n n n t t t No<br />
Bassing <strong>Harbor</strong> (PBA-2) n n n n n n No<br />
Inner Ryder’s Cove (PBA-3) n n s s s s Yes<br />
Outer Ryder’s Cove (CM-13) n n s n n n Yes<br />
Frost Fish Creek (CM-14) n n n n n n No<br />
Crow’s Pond (PBA-4) n n n n n n Yes<br />
Muddy Creek (PBA-5) n n n n n n Yes<br />
Muddy Creek - Upper (PBA-5A) n n n n n n Yes<br />
Big <strong>Bay</strong> - SW (PBA-6) n n n t n n No<br />
Big <strong>Bay</strong> - Mid (PBA-7) n n n n n n No<br />
Big <strong>Bay</strong> - NE (PBA-8) s n n n n n Yes<br />
Round Cove (PBA-9) n n n n n n Yes<br />
Quanset Pond (PBA-10) n n s s n n Yes<br />
Paw Wah Pod (PBA-11) n n n n n n Yes<br />
Namequoit - South (PBA-12) n n n n t n Yes<br />
Namequoit - North (PBA-13) n n n n n n Yes<br />
Arey’s Pond (PBA-14) n n n n n n No<br />
Kescayogansett Pod (PBA-15) n s n n n n Yes<br />
Meetinghouse Pond (PBA-16) n n n n n n No<br />
Allen’s Ministers Point (PBA-18) n n n t t n No<br />
Strong Isl<strong>and</strong> (PBA-19) n n n n n n No<br />
Nickersons Neck (PBA-20) n n n n t n No<br />
Little <strong>Pleasant</strong> <strong>Bay</strong> (PBA-21) n n n n t n No<br />
Pochet Mouth (WMO-3) n n n n n n Yes<br />
Pochet Upper (WMO-5) n n n n n s Yes<br />
Namequoit River Mid (WMO-6) n n n n n n Yes<br />
River at Rattles Dock (WMO-10) t s n n s s Yes<br />
<strong>Pleasant</strong> <strong>Bay</strong> off Quanset (WMO-10) n n n n n n No<br />
Pochet - Mid (WMO-4) n n n n n n No<br />
Namequoit River - Mouth (WMO-7) n n n n n n No<br />
Lower River (WMO-8) n n n n n n No<br />
Mid River (WMO-9) n n n n n n No<br />
Little Quanset Pond (WMO-12) n n n n n n No<br />
31 6 SRANK S2 is defined as “typically 6-20 occurrences, few remaining acres or miles of stream, or very vulnerable to extirpation in Massachusetts for other reasons”.<br />
<strong>Pleasant</strong> <strong>Bay</strong> Alliance 2011
<strong>Coastal</strong> <strong>Resource</strong> <strong>Guide</strong> for <strong>Pleasant</strong> <strong>Bay</strong> <strong>and</strong> <strong>Chatham</strong> <strong>Harbor</strong><br />
Section 8<br />
Bathymetry <strong>and</strong> Navigation<br />
8.1 Purpose<br />
The purpose of this section is to illustrate <strong>and</strong> describe how the<br />
dynamic pattern of growth, elongation <strong>and</strong> periodic breaching<br />
of Nauset Beach described in Section 2 contributes to a highly<br />
variable system of waterways <strong>and</strong> channels in <strong>Chatham</strong> <strong>Harbor</strong> <strong>and</strong><br />
<strong>Pleasant</strong> <strong>Bay</strong>.<br />
8.2 Methodology<br />
A considerable number of studies over the past decade have<br />
looked at the bathymetry <strong>and</strong> hydrodynamics of <strong>Pleasant</strong> <strong>Bay</strong>. The<br />
first of these studies, entitled Hydrodynamic <strong>and</strong> Tidal Flushing:<br />
Study of <strong>Pleasant</strong> <strong>Bay</strong> Estuary, MA, was conducted by Aubrey<br />
Consulting, Inc. in 1997. In 2005, as part of the Massachusetts<br />
Estuary Project (MEP) Technical Report for <strong>Pleasant</strong> <strong>Bay</strong>, bathymetry<br />
measurements were updated <strong>and</strong> hydrodynamics were modeled<br />
once again. The 2005 MEP model was updated in 2007 following<br />
the formation of the second inlet, under a program sponsored by<br />
the Army Corp of Engineers. The 2007 modeling study updated<br />
the <strong>Pleasant</strong> <strong>Bay</strong> RMA-2 model mesh developed for the MEP <strong>and</strong><br />
included the new 2007 inlet <strong>and</strong> updated bathymetry from a 2007<br />
LIDAR survey. The 2007 model also included a harmonic analysis<br />
of tide gage data at Meetinghouse Pond collected between<br />
2005 <strong>and</strong> 2007, as well as ADCP (bathymetric <strong>and</strong> current)<br />
measurements collected in the newly formed inlet in 2007. In<br />
2009, the Alliance commissioned <strong>Coastal</strong> Engineering Company,<br />
Inc. to conduct hydrogeoraphic surveys of all major navigation<br />
channels in <strong>Pleasant</strong> <strong>Bay</strong>. This study was intended to provide a<br />
baseline for monitoring navigation depths <strong>and</strong> potential dredging<br />
needs.<br />
8.3 Overview of the Channel System<br />
The internal channel system has historically fluctuated between<br />
decades of relative stability to other periods of rapid shoaling <strong>and</strong><br />
channel migration. These periods of rapid change are generally a<br />
response to the breaching of Nauset Beach, the creation of new<br />
inlets <strong>and</strong> a large influx of new sediment, increased wave energy<br />
<strong>and</strong> higher current velocities associated with a larger overall tidal<br />
prism. The development of a new inlet in 2007, located north of<br />
the inlet formed in 1987 across from <strong>Chatham</strong> Light, provides for<br />
a more efficient water exchange between the Ocean <strong>and</strong> interior<br />
estuary. This in turn has the tendency to increase the tidal range<br />
inside <strong>Pleasant</strong> <strong>Bay</strong> causing both higher high tides <strong>and</strong> lower low<br />
tides. 1<br />
The navigable waters <strong>and</strong> channels surrounding <strong>Pleasant</strong> <strong>Bay</strong> <strong>and</strong><br />
<strong>Chatham</strong> <strong>Harbor</strong> have historically been relatively shallow except<br />
for the deeper basins of <strong>Pleasant</strong> <strong>Bay</strong> <strong>and</strong> the adjoining inner<br />
tidal ponds. Bathymetric data for <strong>Pleasant</strong> <strong>Bay</strong> <strong>and</strong> navigational<br />
channels is shown in the Map 17 series. Most of these ponds are<br />
Section Highlights<br />
The channel system linking <strong>Pleasant</strong> <strong>Bay</strong> <strong>and</strong> <strong>Chatham</strong><br />
<strong>Harbor</strong> has fluctuated between periods of stability<br />
<strong>and</strong> shoaling, due in large part to changes in tides<br />
resulting from the formation <strong>and</strong> migration of inlets<br />
in the Nauset barrier beach.<br />
The tide range increased .7 feet following the<br />
formation of the 2007 inlet, <strong>and</strong> there is now a<br />
difference of four <strong>and</strong> one-half feet between low <strong>and</strong><br />
high tide. The volume of water exchanging with the<br />
Atlantic Ocean also increased by 11% following the<br />
2007 inlet formation.<br />
The navigable waters <strong>and</strong> channels surrounding<br />
<strong>Pleasant</strong> <strong>Bay</strong> <strong>and</strong> <strong>Chatham</strong> <strong>Harbor</strong> have historically<br />
been relatively shallow except for the deeper basins<br />
of <strong>Pleasant</strong> <strong>Bay</strong> <strong>and</strong> the adjoining inner tidal ponds.<br />
A 2009 hydrogeographic survey measured the<br />
controlling depths of navigational channels<br />
throughout the system. The survey indicated that<br />
navigation access is maintained in all channels,<br />
although in some cases is constrained at low tide.<br />
Shoaling in the vicinity of the 2007 inlet is being<br />
monitored in view of potential negative impacts<br />
to historic access for recreational boaters <strong>and</strong> for<br />
reaching safe haven of commercial fishing boats.<br />
remnant glacial kettle ponds <strong>and</strong> while their inner basins can be<br />
relatively deep, the tidal channels accessing them are typically<br />
shallow. The portions of <strong>Pleasant</strong> <strong>Bay</strong> east of Strong Isl<strong>and</strong> <strong>and</strong><br />
of Little <strong>Pleasant</strong> <strong>Bay</strong> east of Sipson’s, Sampson’s <strong>and</strong> Hog Isl<strong>and</strong>s,<br />
respectively, are characterized by wide shallow bars <strong>and</strong> flats<br />
with depths typically between 0 to 3 feet at MLW. Historically<br />
these areas have been subject to large intrusions of sediment<br />
periodically entering the estuary due to barrier beach washover<br />
<strong>and</strong> new inlet formation. Natural me<strong>and</strong>ering tidal channels are<br />
interspersed throughout these shallow portions of <strong>Pleasant</strong> <strong>Bay</strong><br />
<strong>and</strong> navigation requires considerable local knowledge of the area.<br />
8.4 Boating<br />
<strong>Pleasant</strong> <strong>Bay</strong> <strong>and</strong> <strong>Chatham</strong> <strong>Harbor</strong> have a long history as prime<br />
areas for recreational <strong>and</strong> commercial boating. The estuary’s<br />
location at the elbow of the Outer Cape is in close proximity to<br />
productive near <strong>and</strong> offshore fishing resources <strong>and</strong> also provides<br />
1 A hydrodynamic modeling study conducted by the US Army Corp of Engineers just months after the formation of the 2007 inlet, found that the new second inlet<br />
resulted in an increase in tidal range of 0.7 feet, from 3.6 feet pre-breach to 4.3 feet post-breach (a 1.1 foot increase in tide range was measured by the Fish Pier tide<br />
gage). System-wide, the tidal prism, which is the volume of water exchanged between <strong>Pleasant</strong> <strong>Bay</strong> <strong>and</strong> the Atlantic Ocean, increased 14.9% while the tidal prism at<br />
the 1987 inlet decreased by 24%.<br />
32<br />
<strong>Pleasant</strong> <strong>Bay</strong> Alliance 2011
<strong>Coastal</strong> <strong>Resource</strong> <strong>Guide</strong> for <strong>Pleasant</strong> <strong>Bay</strong> <strong>and</strong> <strong>Chatham</strong> <strong>Harbor</strong><br />
a safe harbor for vessels accessing the Atlantic Ocean. These<br />
attributes have contributed to the development of <strong>Chatham</strong><br />
as homeport to the largest commercial fishing fleet on Cape<br />
Cod. The barrier beach system has also created a naturally large,<br />
sheltered estuary which is extremely popular for recreational small<br />
boating <strong>and</strong> shallow draft sailing.<br />
The vast majority of the boats moored or launched in <strong>Chatham</strong><br />
<strong>Harbor</strong> <strong>and</strong> <strong>Pleasant</strong> <strong>Bay</strong> range from 15 to 25 feet in length, with<br />
a few vessels up to about 35 feet. The majority of these vessels<br />
have draft requirements of less than 3 feet in depth. A few larger<br />
inboard recreational vessels use the system but the majority of<br />
larger vessels comprise the <strong>Chatham</strong> commercial fishing fleet<br />
located in <strong>Chatham</strong> <strong>Harbor</strong> <strong>and</strong> Aunt Lydia’s Cove. Even these<br />
vessels, which measure in the range of 35 to 45 feet, are not<br />
particularly large when compared to other commercial fishing<br />
ports. Drafts of the commercial vessels typically range between 3.5<br />
to 7.5 feet. Few large sailing vessels are located in <strong>Pleasant</strong> <strong>Bay</strong> or<br />
<strong>Chatham</strong> <strong>Harbor</strong> due to the shallow depths <strong>and</strong> severely limited<br />
access through <strong>and</strong> over the inlet bars.<br />
8.5 Historical Channel Depths <strong>and</strong> Dredging<br />
<strong>Pleasant</strong> <strong>Bay</strong> <strong>and</strong> <strong>Chatham</strong> <strong>Harbor</strong> are considered relatively shoaled<br />
water bodies from the perspective of navigation. Access through<br />
the inlets is limited. Relatively deep water (fifteen feet or more at<br />
MLW) exists in the main basin of <strong>Pleasant</strong> <strong>Bay</strong> <strong>and</strong> a few other<br />
areas. However many of the connecting channels, nearshore areas<br />
<strong>and</strong> narrow tidal creeks <strong>and</strong> rivers are severely restricted to depths<br />
of three feet at MLW or less. Some of the tidal ponds such as<br />
Arey’s, Lonnie’s <strong>and</strong> Quanset ponds have entrance channels with<br />
only about one to two feet of water depth at MLW. The general<br />
prevalence of shoal water in <strong>Pleasant</strong> <strong>Bay</strong> has effectively limited<br />
the size <strong>and</strong> draft requirements of vessels utilizing the waterways.<br />
While dredging has been historically performed in some locations,<br />
most active dredging has been limited to the channels accessing<br />
Aunt Lydia’s Cove <strong>and</strong> Round Cove.<br />
Dredged material from Aunt Lydia’s Cove is pumped onto Andrew<br />
Harding Beach. Photo: Ted Keon<br />
Recent maintenance dredging at Round Cove has been performed<br />
by the Barnstable County dredge, Codfish, which is a cutterhead<br />
suction pipeline dredge. Aunt Lydia’s Cove, which is the home<br />
port for <strong>Chatham</strong>’s important commercial fishing fleet, is a federal<br />
navigation project <strong>and</strong> dredging is performed by the U.S. Army<br />
Corps of Engineers’ special purpose hopper dredge, Currituck.<br />
Supplemental maintenance dredging of Aunt Lydia’s Cove is also<br />
occasionally accomplished by the Codfish. Minor maintenance<br />
dredging along bulkheads <strong>and</strong> ramps at public l<strong>and</strong>ings in other<br />
areas within <strong>Pleasant</strong> <strong>Bay</strong> <strong>and</strong> <strong>Chatham</strong> <strong>Harbor</strong> is generally<br />
performed mechanically by either a crane with a clamshell<br />
bucket or excavator. The material removed from the harbors <strong>and</strong><br />
waterways of these dredging projects is generally clean, beach<br />
compatible s<strong>and</strong>. Therefore, it is appropriate to reutilize this<br />
material in a beneficial manner as beach nourishment which has<br />
been the common practice for disposal of the dredged material<br />
within <strong>Pleasant</strong> <strong>Bay</strong> <strong>and</strong> <strong>Chatham</strong> <strong>Harbor</strong>.<br />
A marked navigation channel maintained by the <strong>Harbor</strong>masters<br />
from Orleans <strong>and</strong> <strong>Chatham</strong> extends from the <strong>Chatham</strong> inlet<br />
opposite the <strong>Chatham</strong> Lighthouse to the northern terminus at<br />
Meetinghouse Pond. This channel identifies the preferred <strong>and</strong><br />
“best water” conditions along the main north to south axis of the<br />
estuary in order to navigate from one end to the other. Depths<br />
along this channel can vary significantly but generally range<br />
between four to seven feet at MLW. Migrating shoals, particularly<br />
in <strong>Chatham</strong> can change the orientation of this channel as well as<br />
further restricting depths. Nonetheless, three feet at MLW has<br />
been the approximate limiting controlling depth along the main<br />
marked navigation channel through <strong>Pleasant</strong> <strong>Bay</strong> <strong>and</strong> <strong>Chatham</strong><br />
<strong>Harbor</strong> for the past several decades. Map 18 illustrates the primary<br />
marked navigation channel from the southern <strong>Chatham</strong> Inlet<br />
through Meetinghouse Pond in Orleans. It also shows the location<br />
of the other marked tributary channels providing access to the<br />
various sub-embayments within the system.<br />
33<br />
Federal dredge, the Currituck. Photo: Ted Keon<br />
<strong>Pleasant</strong> <strong>Bay</strong> Alliance 2011
<strong>Coastal</strong> <strong>Resource</strong> <strong>Guide</strong> for <strong>Pleasant</strong> <strong>Bay</strong> <strong>and</strong> <strong>Chatham</strong> <strong>Harbor</strong><br />
Table 5. Controlling Depths in <strong>Pleasant</strong> <strong>Bay</strong><br />
Approx. Controlling<br />
Depth (MLW) 2<br />
Minister’s Point to <strong>Pleasant</strong> <strong>Bay</strong>, <strong>Chatham</strong> (4 ft. by 60 ft.) -4.5 ft (-1.4 m)<br />
Bassing <strong>Harbor</strong> Entrance Channel, <strong>Chatham</strong> (4 ft. by 60 ft.) -3.0 ft (-0.9 m)<br />
Crows Pond, <strong>Chatham</strong> (4 ft. by 40 ft. (1.2 m by 12 m) ) -3.0 ft (-0.9 m)<br />
Round Cove, Harwich (6 ft by 30 ft.) -4.0 ft (-1.2 m)<br />
Quanset Pond, Orleans (3 ft. by 30 ft.) -1.5 ft (-.46 m)<br />
The Narrows, Orleans (3 ft. by 50 ft.) -4.5 ft (-1.4 m)<br />
Paw Wah Pond, Orleans (3 ft. by 24 ft.) -1.0 ft (-0.3 m)<br />
Arey’s Pond, Orleans (3 ft. by 24 ft.) -1.5 ft (-.46 m)<br />
Lonnie’s Pond, Orleans (3 ft. by 24 ft.) -1.0 ft (-0.3 m)<br />
The River to Meetinghouse Pond, Orleans (3 ft. by 30 ft.) -6.0 ft (-2.8m)<br />
Source: Hydrogeographic survey of <strong>Pleasant</strong> <strong>Bay</strong>, <strong>Coastal</strong> Engineering, 2009<br />
8.6 Existing Bathymetric Conditions<br />
The new inlet through Nauset Beach formed in April 2007<br />
is anticipated to cause various levels of impact to navigation<br />
throughout <strong>Pleasant</strong> <strong>Bay</strong> <strong>and</strong> <strong>Chatham</strong> <strong>Harbor</strong>. The National<br />
Oceanic <strong>and</strong> Atmospheric Administration (NOAA) installed a tide<br />
gauge at the <strong>Chatham</strong> Fish Pier during the spring of 2009. Based<br />
on an analysis of the recent tide data, NOAA has confirmed that<br />
as of May 2009, the tide range at the Fish Pier from MLW to MHW<br />
has increased approximately one-foot due to the 2007 break. This<br />
increase in range is comprised of approximately 0.8 feet in lower<br />
tide levels at MLW <strong>and</strong> 0.25 feet of higher tide levels at MHW.<br />
Therefore, from the perspective of navigation, the estuary is now<br />
shallower at low tide <strong>and</strong> areas that previously were marginally<br />
navigable at MLW may now not be passable for certain vessels.<br />
As the 2007 inlet formed <strong>and</strong> widened, large amounts of new<br />
s<strong>and</strong> were carried into <strong>Chatham</strong> <strong>Harbor</strong>. At the same time,<br />
the larger tidal prism entering through the inlet has caused an<br />
increase in tidal current velocities in certain areas. These two<br />
factors have the potential to cause additional shoaling within<br />
existing navigation channels. The stronger current velocities also<br />
may cause previously stable shoals <strong>and</strong> bars to move <strong>and</strong> migrate<br />
with impacts to navigation. This issue is more likely to occur in<br />
the general vicinity of the new inlet although increased current<br />
velocities have caused some shifting of shoals <strong>and</strong> tidal channels<br />
significantly removed from the new inlet.<br />
This concern about possible shallower depths within existing<br />
navigable channels precipitated the establishment of a baseline<br />
hydrogeographic survey of existing bathymetry. These surveys<br />
were only conducted in the principal navigation channels where<br />
it was felt that navigable depths may be negatively impacted <strong>and</strong><br />
where dredging might be considered if deemed necessary. This<br />
survey effort identified both the approximate MLW depths along<br />
the channel as well as the estimated volume of material that<br />
would need to be dredged to return the channel to the design<br />
dimensions. These results are based on survey data completed in<br />
the fall of 2008.<br />
The location <strong>and</strong> channel dimensions (depth at MLW by width)<br />
where the surveys were performed as well as the approximate<br />
minimum depths (also referred to as the controlling depths)<br />
Table 6. Estimated Dredge Volumes<br />
Dredge Over-Depth Total<br />
Volume Volume Volume<br />
Minister’s Point to <strong>Pleasant</strong> <strong>Bay</strong>, (4 ft. by 60 ft.) 0 795 795<br />
Bassing <strong>Harbor</strong> Entrance Channel, (4 ft. by 60 ft.) 2,310 5,535 7,845<br />
Crows Pond, (4 ft. by 40 ft.) 1,943 2,916 4,859<br />
Round Cove, (6 ft by 30 ft.) 1,300 1,450 2,750<br />
Quanset Pond, (3 ft. by 30 ft.) 365 410 775<br />
The Narrows, (3 ft. by 50 ft.) 0 0 0<br />
Paw Wah Pond, (3 ft. by 24 ft.) 1,530 1,020 2,550<br />
Arey’s Pond, (3 ft. by 24 ft.) 850 1,860 2,710<br />
Lonnie’s Pond, (3 ft. by 24 ft.) 1,603 1,705 3,308<br />
The River to Meetinghouse Pond, (3 ft. by 30 ft.) 0 250 250<br />
Source: Hydrogeographic survey of <strong>Pleasant</strong> <strong>Bay</strong>, <strong>Coastal</strong> Engineering, 2009<br />
2 The negative sign indicates depth below MLW, which is 0. Therefore, -4.5 MLW is a water depth of 4.5 feet at MLW.<br />
34<br />
<strong>Pleasant</strong> <strong>Bay</strong> Alliance 2011
<strong>Coastal</strong> <strong>Resource</strong> <strong>Guide</strong> for <strong>Pleasant</strong> <strong>Bay</strong> <strong>and</strong> <strong>Chatham</strong> <strong>Harbor</strong><br />
increased the overall tidal prism entering <strong>Chatham</strong> <strong>Harbor</strong> <strong>and</strong><br />
<strong>Pleasant</strong> <strong>Bay</strong>. This larger volume of water, in turn, increased tidal<br />
ranges approximately 1.6 ft as well as increased current velocities<br />
throughout the system. These increased velocities caused the<br />
migration of some shoals <strong>and</strong> channel systems that had been<br />
relatively stable for many years prior to the 1987 inlet. Within a<br />
few years after the inlet break, the channels <strong>and</strong> shoal systems<br />
within the mid <strong>and</strong> upper regions of <strong>Pleasant</strong> <strong>Bay</strong> became more<br />
equilibrated to the new hydraulic regime. <strong>Chatham</strong> <strong>Harbor</strong>,<br />
however, was still undergoing considerable change twenty years<br />
after the inlet breach due to close proximity to the inlet.<br />
Dredging with an excavator at the Fish Pier. Photo: Ted Keon<br />
The total volume of material, which would be generated if the<br />
channels were dredged to the design dimensions, is shown in Table<br />
6. The volume is based on cubic yards <strong>and</strong> the over-depth assumes<br />
one foot of additional dredging beyond the design depth. Note<br />
that the dredge volume assumes establishing the project design<br />
depth along the full channel width.<br />
8.7 Shoal Migration Patterns<br />
As stated above, much of the <strong>Pleasant</strong> <strong>Bay</strong> system is characterized<br />
by shallow s<strong>and</strong>y shoals <strong>and</strong> me<strong>and</strong>ering channels. Unlike fine<br />
grained silts <strong>and</strong> clays which are easily disturbed <strong>and</strong> transported<br />
within the water column, s<strong>and</strong> needs a relatively high energy<br />
environment to become mobile. Therefore, the areas of greatest<br />
shoal movement are generally in the vicinity of tidal inlets <strong>and</strong><br />
channels with high tidal currents. 3<br />
Areas adjacent to tidal inlets are particularly prone to migrating<br />
shoal patterns given the large potential for sediment introduction<br />
from the ocean beaches, strong tidal currents <strong>and</strong> high wave<br />
energy. <strong>Chatham</strong> <strong>Harbor</strong> quickly became recognized as having<br />
some of the most dynamic channel <strong>and</strong> shoal systems in the<br />
Commonwealth following the formation of the new inlet near the<br />
<strong>Chatham</strong> Lighthouse in 1987. The inlet caused the development<br />
of a highly variable flood <strong>and</strong> ebb shoal complex that were<br />
challenging to navigate. These changes required the development<br />
of an extensive dredging program to maintain navigation access<br />
for the <strong>Chatham</strong>’s commercial fishing fleet. The 1987 inlet also<br />
enabled higher energy waves to enter <strong>Chatham</strong> <strong>Harbor</strong>, which<br />
resulted in considerable erosion of the adjoining, previously<br />
sheltered, internal beaches <strong>and</strong> upl<strong>and</strong> property along the<br />
mainl<strong>and</strong>. This erosion contributed littoral sediments to <strong>Pleasant</strong><br />
<strong>Bay</strong>, which modified shoals in <strong>Chatham</strong> <strong>Harbor</strong>.<br />
The more recent inlet breach in 2007 has already caused many<br />
changes to the adjacent interior shoal systems <strong>and</strong> it is anticipated<br />
that considerable modifications will continue to occur as the inlet<br />
further develops (see Figure 6 found in section 2). Given the<br />
northern location of the 2007 inlet, the upper portions of <strong>Chatham</strong><br />
<strong>Harbor</strong> <strong>and</strong> southern waters of <strong>Pleasant</strong> <strong>Bay</strong> near Ministers Point<br />
<strong>and</strong> Strong Isl<strong>and</strong> are likely to be regions of greatest change. This<br />
dynamic potential is related to the influx of large, new sediment<br />
supplies <strong>and</strong> further increases in tidal flow. Many of the channel<br />
systems between the <strong>Chatham</strong> mainl<strong>and</strong> <strong>and</strong> Strong Isl<strong>and</strong> already<br />
have become more dynamic due to the higher current velocities.<br />
A new flood shoal complex is forming inside the new inlet <strong>and</strong><br />
at this time it is unclear how, where, or in what manner this<br />
flood shoal will ultimately migrate. It is equally unclear how the<br />
traditional navigation channels will respond to the intrusion of new<br />
sediments, shoal movement <strong>and</strong> increased current velocities. Map<br />
18 identifies the area where the greatest amount of shoal <strong>and</strong><br />
channel migration is expected to occur over the next several years.<br />
The 2007 inlet has altered s<strong>and</strong> <strong>and</strong> channel stability within the<br />
portion of <strong>Chatham</strong> <strong>Harbor</strong> between the two inlets. The 2007<br />
inlet has captured a significant volume of the overall tidal prism<br />
for <strong>Pleasant</strong> <strong>Bay</strong>. Therefore, current velocities have moderated<br />
somewhat between the two inlets since the southern inlet is<br />
contributing less water to the estuary. This has slowed the rate<br />
<strong>and</strong> extent of shoal migration in <strong>Chatham</strong> <strong>Harbor</strong> <strong>and</strong> it is likely<br />
that the previously highly mobile flood shoal complex will become<br />
increasingly more stable in the short term. However, the longer<br />
term changes within this portion of <strong>Chatham</strong> <strong>Harbor</strong> may still be<br />
significant. Over the next few decades, it is assumed that the<br />
remnant isl<strong>and</strong> between the two inlets will break-up <strong>and</strong> ultimately<br />
migrate in an anticipated west to southwesterly direction. This<br />
has the potential to significantly alter the network of shoals <strong>and</strong><br />
channels <strong>and</strong> shoreline morphology in <strong>Chatham</strong> <strong>Harbor</strong> in the<br />
coming years.<br />
In addition to causing the growth <strong>and</strong> migration of large flood<br />
shoal systems within the adjacent harbor, the 1987 inlet also<br />
35<br />
3 Barrier beach overwash is another mechanism whereby sediments are added to the interior estuary which can then be redistributed by waves <strong>and</strong> currents. This is a<br />
more episodic event generally only occurring during large storm events <strong>and</strong> effecting areas immediately l<strong>and</strong>ward of the barrier beach.<br />
<strong>Pleasant</strong> <strong>Bay</strong> Alliance 2011
<strong>Coastal</strong> <strong>Resource</strong> <strong>Guide</strong> for <strong>Pleasant</strong> <strong>Bay</strong> <strong>and</strong> <strong>Chatham</strong> <strong>Harbor</strong><br />
Sources<br />
Borrelli, M., (2009). 137 years of Shoreline Change in <strong>Pleasant</strong> <strong>Bay</strong>: 1868 - 2005. Technical report submitted to the <strong>Pleasant</strong> <strong>Bay</strong> <strong>Resource</strong><br />
Management Alliance. Harwich, Massachusetts. 29 p.<br />
Cape Cod Commission. Barnstable County, Cape Cod, Massachusetts Multi-Hazard Mitigation Plan. Prepared for the Federal Emergency<br />
Management Agency to comply with the DMA Act of 2000. 2010.<br />
Carlisle, B.K., A.M. Donovan, A.L. Hicks, V.S. Kooken, J.P. Smith, <strong>and</strong> A.R. Wilbur (2002). A Volunteer’s H<strong>and</strong>book for Monitoring New<br />
Engl<strong>and</strong> Salt Marshes. Massachusetts Office of <strong>Coastal</strong> Zone Management, Boston, MA.<br />
Carmichael, Ruth, H., D. Rutecki, <strong>and</strong> I. Valiela (2003). Abundance <strong>and</strong> population structure of the Atlantic horseshoe crab Limulus<br />
polyphemus in <strong>Pleasant</strong> <strong>Bay</strong>, Cape Cod. Marine Ecology Progress Series, Vol. 246: 225–239, 2003<br />
<strong>Coastal</strong> Engineering Company, Inc. (2009). <strong>Pleasant</strong> <strong>Bay</strong> Hydrographic Survey. Prepared for the <strong>Pleasant</strong> <strong>Bay</strong> Alliance.<br />
Commonwealth of Massachusetts (EOEA) <strong>and</strong> Massachusetts Dept. of Environmental Protection (2007). <strong>Pleasant</strong> <strong>Bay</strong> System Total<br />
Maximum Daily Loads For Total Nitrogen (Final Report # 96-TMDL-12, Control #244.0).<br />
Costa, Joe (no date). Eelgrass in Buzzards <strong>Bay</strong> (http://www.buzzardsbay.org/eelgrass.htm)<br />
Farber, Dawson. (2010). Interview with J. Andrew Walsh.<br />
Giese, Graham S. (1978). The Barrier Beaches of <strong>Chatham</strong>, Massachusetts. A Study Undertaken for the Conservation Commission, Town<br />
of <strong>Chatham</strong>, Massachusetts. Provincetown Center for <strong>Coastal</strong> Studies.<br />
Giese, Graham S.; Mague, Steven T.; Rogers, Stacy S. (2009). A Geomorphological Analysis of Nauset Beach/<strong>Pleasant</strong> <strong>Bay</strong>/<strong>Chatham</strong> <strong>Harbor</strong><br />
For the Purpose of Estimating Future Configurations <strong>and</strong> Conditions. A Study Undertaken for the <strong>Pleasant</strong> <strong>Bay</strong> Alliance. Provincetown<br />
Center for <strong>Coastal</strong> Studies.<br />
Horsley & Witten, Inc. (2003). A Qualitative Survey of Pond Shoreline Vegetation <strong>and</strong> Anthropogenic Threats at Eleven Freshwater Ponds<br />
in the <strong>Pleasant</strong> <strong>Bay</strong> Area of Critical Environmental Concern, <strong>Chatham</strong> <strong>and</strong> Orleans, Massachusetts.<br />
Howes B., S. W. Kelley, J.S. Ramsey, R. Samimy, D. Schlezinger, E. Eichner (2006). Linked Watershed-Embayment Model to Determine<br />
Critical Nitrogen Loading Thresholds for <strong>Pleasant</strong> <strong>Bay</strong>, <strong>Chatham</strong>, Massachusetts. Massachusetts Estuaries Project, Massachusetts<br />
Department of Environmental Protection. Boston, MA. 227pp.<br />
Jackson, J.A. (2005). Glossary of Geology. 5th ed. ISBN 3-540-27951-2. Berlin: Springer, 2005.<br />
James-Pirri, M. J., et al. (2005). Spawning Densities, Egg Densities, Size Structure, <strong>and</strong> Movement Patterns of Spawning Horseshoe Crabs,<br />
Limulus polyphemus, within Four <strong>Coastal</strong> Embayments on Cape Cod, Massachusetts. Estuaries Vol. 28, No. 2, p. 296–313, April 2005.<br />
MassGIS. DEP Wetl<strong>and</strong>s (1:12,000) (August 2011), Shellfish Suitability Areas.<br />
Massachusetts Wetl<strong>and</strong>s Protection Act (M.G.L. c. 131, s. 40) <strong>and</strong> Regulations (310 CMR 10.00).<br />
Moore, Stuart. (2010). Interview with J. Andrew Walsh.<br />
Murphy, Diane. (2010). Interview with J. Andrew Walsh.<br />
National Oceanic <strong>and</strong> Atmospheric Administration, et al. (2001). Massachusetts Environmental Sensitivity Index Metadata<br />
Oldale, Robert (rev. 2001). Cape Cod, Martha’s Vineyard & Nantucket: The Geologic Story. On Cape Publications, 226 p.<br />
Oldale, Robert, N. <strong>and</strong> Carl Koteff (1970). Geologic Quadrangle Map of the <strong>Chatham</strong> Quadrangle, Barnstable County, Cape Cod,<br />
Massachusetts. Published by <strong>Pleasant</strong> <strong>Bay</strong> Area of Critical Environmental Concern (http://www.mass.gov/dcr/stewardship/acec/acecs/lplebay.htm)<br />
Oldale, Robert, N., Carl Koteff <strong>and</strong> J.H. Hartshorn (1971). Geologic Quadrangle Map of the Orleans Quadrangle, Barnstable County, Cape<br />
Cod, Massachusetts. Published by the U.S. Geological Survey.<br />
36<br />
<strong>Pleasant</strong> <strong>Bay</strong> Alliance 2011
<strong>Coastal</strong> <strong>Resource</strong> <strong>Guide</strong> for <strong>Pleasant</strong> <strong>Bay</strong> <strong>and</strong> <strong>Chatham</strong> <strong>Harbor</strong><br />
Prescott, Robert. (2010). Interview with J. Andrew Walsh.<br />
Rutecki, Deborah, R. H. Carmichael, <strong>and</strong> I. Valiela, (2004). Magnitude of Harvest of Atlantic Horseshoe Crabs, Limulus polyphemus, in<br />
<strong>Pleasant</strong> <strong>Bay</strong>, Massachusetts. Estuaries, Vol. 27, No. 2, p. 179-187. April 2004.<br />
Smith, D. R., M. J. Millard, <strong>and</strong> R.H. Carmichael (2009). Comparative status <strong>and</strong> assessment of Limulus polyphemus with<br />
emphasis on the New Engl<strong>and</strong> <strong>and</strong> Delaware <strong>Bay</strong> populations. p. 361-386. In J.T. Tanacredi et al. (eds.), Biology <strong>and</strong><br />
Conservation of Horseshoe Crabs (2009).<br />
Smith, Stephen M. (2009). Multi-decadal Changes in Salt Marshes of Cape Cod, MA: Photographic Analyses of Vegetation Loss, Species<br />
Shifts, <strong>and</strong> Geomorphic Change. Northeastern Naturalist, V. 16, No. 2, pp. 183-208.<br />
Stone, Byron D., M. L. DiGiacomo-Cohen (2009). Surficial geologic map of the Pocasset-Provincetown-Cuttyhunk-Nantucket<br />
24-quadrangle area of Cape Cod <strong>and</strong> Isl<strong>and</strong>s, southeast Massachusetts: U.S. Geological Survey Open File Report 2006 1260-E.<br />
The Cadmus Group, Inc. (2010). <strong>Pleasant</strong> <strong>Bay</strong> Alliance Water Quality Monitoring Program: Statistical Analysis of Multi-year Water Quality<br />
Monitoring Data. Prepared by the Cadmus Group, Inc., 57 Water St., Watertown, MA 02472. Prepared for the <strong>Pleasant</strong> <strong>Bay</strong> Alliance.<br />
Tiner, R.W. (2010). Wetl<strong>and</strong>s of Cape Cod <strong>and</strong> the Isl<strong>and</strong>s, Massachusetts: Results of the National Wetl<strong>and</strong>s Inventory <strong>and</strong> L<strong>and</strong>scapelevel<br />
Functional Assessment. National Wetl<strong>and</strong>s Inventory report. U.S. Fish <strong>and</strong> Wildlife Service, Northeast Region, Hadley, MA. 78 pp.<br />
plus appendices.<br />
Theiler, Rob. (2009). Planning for Sea Level Rise <strong>and</strong> Shoreline Change at the Local Level. U.S. Geological Survey.<br />
University of Massachusetts Dartmouth (School of Marine Science <strong>and</strong> Technology) <strong>and</strong> Massachusetts Department of Environmental<br />
Protection (2006). Linked Watershed-Embayment Model to Determine Critical Nitrogen Loading Thresholds for the <strong>Pleasant</strong> <strong>Bay</strong> System,<br />
Towns of Orleans, <strong>Chatham</strong>, Brewster <strong>and</strong> Harwich, Massachusetts. Massachusetts Estuaries Project. Final Report-May 2006.<br />
Massachusetts Department of Environmental Protection (2003). Small Docks <strong>and</strong> Piers – A <strong>Guide</strong> to Permitting Small, Pile-Supported<br />
Docks <strong>and</strong> Piers.<br />
<strong>Pleasant</strong> <strong>Bay</strong> <strong>Resource</strong> Management Alliance (1999). <strong>Guide</strong>lines <strong>and</strong> Performance St<strong>and</strong>ards for Docks & Piers in <strong>Pleasant</strong> <strong>Bay</strong>.<br />
<strong>Pleasant</strong> <strong>Bay</strong> <strong>Resource</strong> Management Alliance (2002). <strong>Guide</strong>lines for Private Walkways <strong>and</strong> Stairways in Fresh <strong>and</strong> Marine <strong>Resource</strong>s Areas<br />
in <strong>Pleasant</strong> <strong>Bay</strong>.<br />
<strong>Pleasant</strong> <strong>Bay</strong> <strong>Resource</strong> Management Plan. <strong>Pleasant</strong> <strong>Bay</strong> Technical <strong>Resource</strong> Committee <strong>and</strong> Ridley & Associates, Inc., 1996.<br />
<strong>Pleasant</strong> <strong>Bay</strong> <strong>Resource</strong> Management Plan (2008 Update). <strong>Pleasant</strong> <strong>Bay</strong> <strong>Resource</strong> Management Alliance <strong>and</strong> Ridley & Associates, Inc.,<br />
March 2008.<br />
Websites:<br />
United States Environmental Protection Agency<br />
http://water.epa.gov<br />
National Oceanic <strong>and</strong> Atmospheric Admininstration<br />
http://www.noaa.gov/<br />
The <strong>Coastal</strong> Portal Fl<strong>and</strong>ers Marine Institute<br />
http://www.coastalwiki.org<br />
United States Geological Survey (USGS) <strong>Coastal</strong> <strong>and</strong> Marine Geology Program<br />
http://marine.usgs.gov<br />
Dictionary.com<br />
http://dictionary.reference.com<br />
37<br />
<strong>Pleasant</strong> <strong>Bay</strong> Alliance 2011
<strong>Coastal</strong> <strong>Resource</strong> <strong>Guide</strong> for <strong>Pleasant</strong> <strong>Bay</strong> <strong>and</strong> <strong>Chatham</strong> <strong>Harbor</strong><br />
Maps<br />
Page 39 Map 1 <strong>Pleasant</strong> <strong>Bay</strong> Region <strong>and</strong> Study Area<br />
Shoreline Change<br />
Page 40 Map 2A North<br />
Page 41 Map 2B West<br />
Page 42 Map 2C Mid<br />
Page 43 Map 2D South<br />
Sediment Movement<br />
Page 44 Map 3A <strong>Bay</strong>wide<br />
Page 45 Map 3B North<br />
Page 46 Map 3C West<br />
Page 47 Map 3D Mid<br />
Page 48 Map 3E South<br />
Shoreline Structures<br />
Page 49 Map 4A North<br />
Page 50 Map 4B West<br />
Page 51 Map 4C Mid<br />
Page 52 Map 4D South<br />
Page 53 Map 5 Docks <strong>and</strong> Piers<br />
Page 54 Map 6 Historic Hurricane Paths<br />
Page 55 Map 7 FEMA Flood Zones<br />
Page 56 Map 8 Public Access Points<br />
Page 57 Map 9 Surficial Geology<br />
<strong>Coastal</strong> Wetl<strong>and</strong> <strong>Resource</strong>s<br />
Page 58 Map 10A North<br />
Page 59 Map 10B West<br />
Page 60 Map 10C Mid<br />
Page 61 Map 10D South<br />
Page 62 Map 11 Areas of Critical Marine Habitat<br />
Page 63 Map 12 Eelgrass Coverage<br />
Page 64 Map 13 Fish <strong>and</strong> Wildlife<br />
Page 65 Map 14 Rare Species Habitat<br />
Page 66 Map 15 Shellfish Suitability Areas<br />
Page 67 Map 16 HESP Priority <strong>and</strong> Estimated Habitat<br />
Bathymetry Data for Navigational Channels<br />
Page 68 Map 17A <strong>Bay</strong> wide data coverage<br />
Page 69 Map 17B Meetinghouse Pond<br />
Page 70 Map 17C Arey’s Pond<br />
Page 71 Map 17D Paw Wah Pond<br />
Page 72 Map 17E Quanset Pond<br />
Page 73 Map 17F Round Cove<br />
Page 74 Map 17G Crows Pond<br />
Page 75 Map 17H Bassing <strong>Harbor</strong><br />
Page 76 Map 17 I Ministers Point<br />
Page 77 Map 18 Historic Navigation Channels, Areas of Maintenance Dredging <strong>and</strong> Possible Area of Shoaling<br />
38<br />
<strong>Pleasant</strong> <strong>Bay</strong> Alliance 2011
<strong>Coastal</strong> <strong>Resource</strong> <strong>Guide</strong> for <strong>Pleasant</strong> <strong>Bay</strong> <strong>and</strong> <strong>Chatham</strong> <strong>Harbor</strong><br />
39<br />
Map 1<br />
<strong>Pleasant</strong> <strong>Bay</strong> Alliance 2011
<strong>Coastal</strong> <strong>Resource</strong> <strong>Guide</strong> for <strong>Pleasant</strong> <strong>Bay</strong> <strong>and</strong> <strong>Chatham</strong> <strong>Harbor</strong><br />
<strong>Pleasant</strong> <strong>Bay</strong> Atlas<br />
North<br />
Shoreline Change<br />
Based on the Marshline<br />
Erosion<br />
Within the<br />
Range of Uncertainty<br />
Accretion<br />
µ<br />
0 0.125 0.25 0.5<br />
Miles<br />
0 0.25 0.5 1<br />
Kilometers<br />
The information depicted on these maps<br />
is for planning purposes only. It is not<br />
adequate for legal boundary definition,<br />
regulatory interpretation, or parcel level<br />
analysis. It should not substitute for<br />
actual on-site survey, or supersede<br />
deed research.<br />
<strong>Pleasant</strong> <strong>Bay</strong> Alliance 2011<br />
Map 2A<br />
40
<strong>Coastal</strong> <strong>Resource</strong> <strong>Guide</strong> for <strong>Pleasant</strong> <strong>Bay</strong> <strong>and</strong> <strong>Chatham</strong> <strong>Harbor</strong><br />
<strong>Pleasant</strong> <strong>Bay</strong> Atlas<br />
West<br />
Shoreline Change<br />
Based on the Marshline<br />
Erosion<br />
Within the<br />
Range of Uncertainty<br />
Accretion<br />
µ<br />
0 0.125 0.25 0.5<br />
Miles<br />
0 0.25 0.5 1<br />
Kilometers<br />
The information depicted on these maps<br />
is for planning purposes only. It is not<br />
adequate for legal boundary definition,<br />
regulatory interpretation, or parcel level<br />
analysis. It should not substitute for<br />
actual on-site survey, or supersede<br />
deed research.<br />
41<br />
Map 2B<br />
<strong>Pleasant</strong> <strong>Bay</strong> Alliance 2011
<strong>Coastal</strong> <strong>Resource</strong> <strong>Guide</strong> for <strong>Pleasant</strong> <strong>Bay</strong> <strong>and</strong> <strong>Chatham</strong> <strong>Harbor</strong><br />
0 0.25<br />
0.5 1<br />
Miles<br />
0 0.25 0.5 1<br />
Kilometers<br />
The information depicted on these maps is for planning purposes only.<br />
It is not adequate for legal boundary definition, regulatory<br />
interpretation, or parcel level analysis. It should not substitute for<br />
actual on-site survey, or supersede deed research.<br />
µ<br />
<strong>Pleasant</strong> <strong>Bay</strong> Alliance 2011<br />
<strong>Pleasant</strong> <strong>Bay</strong> Atlas: Mid<br />
Shoreline Change<br />
Based on the Marshline<br />
Erosion<br />
Within the Range of Uncertainty<br />
Accretion<br />
Map 2C<br />
42
<strong>Coastal</strong> <strong>Resource</strong> <strong>Guide</strong> for <strong>Pleasant</strong> <strong>Bay</strong> <strong>and</strong> <strong>Chatham</strong> <strong>Harbor</strong><br />
<strong>Pleasant</strong> <strong>Bay</strong> Atlas<br />
South<br />
Shoreline Change<br />
Based on the Marshline<br />
Erosion<br />
Within the<br />
Range of Uncertainty<br />
Accretion<br />
µ<br />
0 0.125 0.25 0.5<br />
Miles<br />
0 0.25 0.5 1<br />
Kilometers<br />
The information depicted on these maps<br />
is for planning purposes only. It is not<br />
adequate for legal boundary definition,<br />
regulatory interpretation, or parcel level<br />
analysis. It should not substitute for<br />
actual on-site survey, or supersede<br />
deed research.<br />
43<br />
Map 2D<br />
<strong>Pleasant</strong> <strong>Bay</strong> Alliance 2011
<strong>Coastal</strong> <strong>Resource</strong> <strong>Guide</strong> for <strong>Pleasant</strong> <strong>Bay</strong> <strong>and</strong> <strong>Chatham</strong> <strong>Harbor</strong><br />
<strong>Pleasant</strong> <strong>Bay</strong> Alliance 2011<br />
Map 3A<br />
44
<strong>Coastal</strong> <strong>Resource</strong> <strong>Guide</strong> for <strong>Pleasant</strong> <strong>Bay</strong> <strong>and</strong> <strong>Chatham</strong> <strong>Harbor</strong><br />
45<br />
Map 3B<br />
<strong>Pleasant</strong> <strong>Bay</strong> Alliance 2011
<strong>Coastal</strong> <strong>Resource</strong> <strong>Guide</strong> for <strong>Pleasant</strong> <strong>Bay</strong> <strong>and</strong> <strong>Chatham</strong> <strong>Harbor</strong><br />
<strong>Pleasant</strong> <strong>Bay</strong> Alliance 2011<br />
Map 3C<br />
46
<strong>Coastal</strong> <strong>Resource</strong> <strong>Guide</strong> for <strong>Pleasant</strong> <strong>Bay</strong> <strong>and</strong> <strong>Chatham</strong> <strong>Harbor</strong><br />
47<br />
Map 3D<br />
<strong>Pleasant</strong> <strong>Bay</strong> Alliance 2011
<strong>Coastal</strong> <strong>Resource</strong> <strong>Guide</strong> for <strong>Pleasant</strong> <strong>Bay</strong> <strong>and</strong> <strong>Chatham</strong> <strong>Harbor</strong><br />
<strong>Pleasant</strong> <strong>Bay</strong> Alliance 2011<br />
Map 3E<br />
48
<strong>Coastal</strong> <strong>Resource</strong> <strong>Guide</strong> for <strong>Pleasant</strong> <strong>Bay</strong> <strong>and</strong> <strong>Chatham</strong> <strong>Harbor</strong><br />
49<br />
Map 4A<br />
<strong>Pleasant</strong> <strong>Bay</strong> Alliance 2011
<strong>Coastal</strong> <strong>Resource</strong> <strong>Guide</strong> for <strong>Pleasant</strong> <strong>Bay</strong> <strong>and</strong> <strong>Chatham</strong> <strong>Harbor</strong><br />
<strong>Pleasant</strong> <strong>Bay</strong> Alliance 2011<br />
Map 4B<br />
50
<strong>Coastal</strong> <strong>Resource</strong> <strong>Guide</strong> for <strong>Pleasant</strong> <strong>Bay</strong> <strong>and</strong> <strong>Chatham</strong> <strong>Harbor</strong><br />
51<br />
Map 4C<br />
<strong>Pleasant</strong> <strong>Bay</strong> Alliance 2011
<strong>Coastal</strong> <strong>Resource</strong> <strong>Guide</strong> for <strong>Pleasant</strong> <strong>Bay</strong> <strong>and</strong> <strong>Chatham</strong> <strong>Harbor</strong><br />
<strong>Pleasant</strong> <strong>Bay</strong> Alliance 2011<br />
Map 4D<br />
52
<strong>Coastal</strong> <strong>Resource</strong> <strong>Guide</strong> for <strong>Pleasant</strong> <strong>Bay</strong> <strong>and</strong> <strong>Chatham</strong> <strong>Harbor</strong><br />
53<br />
Map 5<br />
<strong>Pleasant</strong> <strong>Bay</strong> Alliance 2011
<strong>Coastal</strong> <strong>Resource</strong> <strong>Guide</strong> for <strong>Pleasant</strong> <strong>Bay</strong> <strong>and</strong> <strong>Chatham</strong> <strong>Harbor</strong><br />
<strong>Pleasant</strong> <strong>Bay</strong> Alliance 2011<br />
54<br />
Map 6
<strong>Coastal</strong> <strong>Resource</strong> <strong>Guide</strong> for <strong>Pleasant</strong> <strong>Bay</strong> <strong>and</strong> <strong>Chatham</strong> <strong>Harbor</strong><br />
55<br />
Map 7<br />
<strong>Pleasant</strong> <strong>Bay</strong> Alliance 2011
<strong>Coastal</strong> <strong>Resource</strong> <strong>Guide</strong> for <strong>Pleasant</strong> <strong>Bay</strong> <strong>and</strong> <strong>Chatham</strong> <strong>Harbor</strong><br />
<strong>Pleasant</strong> <strong>Bay</strong> Alliance 2011<br />
Map 8<br />
56
<strong>Coastal</strong> <strong>Resource</strong> <strong>Guide</strong> for <strong>Pleasant</strong> <strong>Bay</strong> <strong>and</strong> <strong>Chatham</strong> <strong>Harbor</strong><br />
57<br />
Map 9<br />
<strong>Pleasant</strong> <strong>Bay</strong> Alliance 2011
<strong>Coastal</strong> <strong>Resource</strong> <strong>Guide</strong> for <strong>Pleasant</strong> <strong>Bay</strong> <strong>and</strong> <strong>Chatham</strong> <strong>Harbor</strong><br />
<strong>Pleasant</strong> <strong>Bay</strong> Alliance 2011<br />
Map 10A<br />
58
<strong>Coastal</strong> <strong>Resource</strong> <strong>Guide</strong> for <strong>Pleasant</strong> <strong>Bay</strong> <strong>and</strong> <strong>Chatham</strong> <strong>Harbor</strong><br />
59<br />
Map 10B<br />
<strong>Pleasant</strong> <strong>Bay</strong> Alliance 2011
<strong>Coastal</strong> <strong>Resource</strong> <strong>Guide</strong> for <strong>Pleasant</strong> <strong>Bay</strong> <strong>and</strong> <strong>Chatham</strong> <strong>Harbor</strong><br />
<strong>Pleasant</strong> <strong>Bay</strong> Alliance 2011<br />
Map 10C<br />
60
<strong>Coastal</strong> <strong>Resource</strong> <strong>Guide</strong> for <strong>Pleasant</strong> <strong>Bay</strong> <strong>and</strong> <strong>Chatham</strong> <strong>Harbor</strong><br />
61<br />
Map 10D<br />
<strong>Pleasant</strong> <strong>Bay</strong> Alliance 2011
<strong>Coastal</strong> <strong>Resource</strong> <strong>Guide</strong> for <strong>Pleasant</strong> <strong>Bay</strong> <strong>and</strong> <strong>Chatham</strong> <strong>Harbor</strong><br />
See page 26 for a description of<br />
the Areas of Critical Marine Habitat<br />
<strong>Pleasant</strong> <strong>Bay</strong> Alliance 2011<br />
Map 11<br />
62
<strong>Coastal</strong> <strong>Resource</strong> <strong>Guide</strong> for <strong>Pleasant</strong> <strong>Bay</strong> <strong>and</strong> <strong>Chatham</strong> <strong>Harbor</strong><br />
63<br />
Map 12<br />
<strong>Pleasant</strong> <strong>Bay</strong> Alliance 2011
<strong>Coastal</strong> <strong>Resource</strong> <strong>Guide</strong> for <strong>Pleasant</strong> <strong>Bay</strong> <strong>and</strong> <strong>Chatham</strong> <strong>Harbor</strong><br />
<strong>Pleasant</strong> <strong>Bay</strong> Alliance 2011<br />
Map 13<br />
64
<strong>Coastal</strong> <strong>Resource</strong> <strong>Guide</strong> for <strong>Pleasant</strong> <strong>Bay</strong> <strong>and</strong> <strong>Chatham</strong> <strong>Harbor</strong><br />
65<br />
Map 14<br />
<strong>Pleasant</strong> <strong>Bay</strong> Alliance 2011
<strong>Coastal</strong> <strong>Resource</strong> <strong>Guide</strong> for <strong>Pleasant</strong> <strong>Bay</strong> <strong>and</strong> <strong>Chatham</strong> <strong>Harbor</strong><br />
<strong>Pleasant</strong> <strong>Bay</strong> Alliance 2011<br />
Map 15<br />
66
<strong>Coastal</strong> <strong>Resource</strong> <strong>Guide</strong> for <strong>Pleasant</strong> <strong>Bay</strong> <strong>and</strong> <strong>Chatham</strong> <strong>Harbor</strong><br />
67<br />
Map 16<br />
<strong>Pleasant</strong> <strong>Bay</strong> Alliance 2011
<strong>Coastal</strong> <strong>Resource</strong> <strong>Guide</strong> for <strong>Pleasant</strong> <strong>Bay</strong> <strong>and</strong> <strong>Chatham</strong> <strong>Harbor</strong><br />
<strong>Pleasant</strong> <strong>Bay</strong> Alliance 2011<br />
Map 17A<br />
68
<strong>Coastal</strong> <strong>Resource</strong> <strong>Guide</strong> for <strong>Pleasant</strong> <strong>Bay</strong> <strong>and</strong> <strong>Chatham</strong> <strong>Harbor</strong><br />
69<br />
Map 17B<br />
<strong>Pleasant</strong> <strong>Bay</strong> Alliance 2011
<strong>Coastal</strong> <strong>Resource</strong> <strong>Guide</strong> for <strong>Pleasant</strong> <strong>Bay</strong> <strong>and</strong> <strong>Chatham</strong> <strong>Harbor</strong><br />
<strong>Pleasant</strong> <strong>Bay</strong> Alliance 2011<br />
Map 17C<br />
70
<strong>Coastal</strong> <strong>Resource</strong> <strong>Guide</strong> for <strong>Pleasant</strong> <strong>Bay</strong> <strong>and</strong> <strong>Chatham</strong> <strong>Harbor</strong><br />
71<br />
Map 17D<br />
<strong>Pleasant</strong> <strong>Bay</strong> Alliance 2011
<strong>Coastal</strong> <strong>Resource</strong> <strong>Guide</strong> for <strong>Pleasant</strong> <strong>Bay</strong> <strong>and</strong> <strong>Chatham</strong> <strong>Harbor</strong><br />
<strong>Pleasant</strong> <strong>Bay</strong> Alliance 2011<br />
Map 17E<br />
72
<strong>Coastal</strong> <strong>Resource</strong> <strong>Guide</strong> for <strong>Pleasant</strong> <strong>Bay</strong> <strong>and</strong> <strong>Chatham</strong> <strong>Harbor</strong><br />
73<br />
Map 17F<br />
<strong>Pleasant</strong> <strong>Bay</strong> Alliance 2011
<strong>Coastal</strong> <strong>Resource</strong> <strong>Guide</strong> for <strong>Pleasant</strong> <strong>Bay</strong> <strong>and</strong> <strong>Chatham</strong> <strong>Harbor</strong><br />
<strong>Pleasant</strong> <strong>Bay</strong> Alliance 2011<br />
Map 17G<br />
74
<strong>Coastal</strong> <strong>Resource</strong> <strong>Guide</strong> for <strong>Pleasant</strong> <strong>Bay</strong> <strong>and</strong> <strong>Chatham</strong> <strong>Harbor</strong><br />
75<br />
Map 17H<br />
<strong>Pleasant</strong> <strong>Bay</strong> Alliance 2011
<strong>Coastal</strong> <strong>Resource</strong> <strong>Guide</strong> for <strong>Pleasant</strong> <strong>Bay</strong> <strong>and</strong> <strong>Chatham</strong> <strong>Harbor</strong><br />
<strong>Pleasant</strong> <strong>Bay</strong> Alliance 2011<br />
Map 17 I<br />
76
<strong>Coastal</strong> <strong>Resource</strong> <strong>Guide</strong> for <strong>Pleasant</strong> <strong>Bay</strong> <strong>and</strong> <strong>Chatham</strong> <strong>Harbor</strong><br />
77<br />
Map 18<br />
<strong>Pleasant</strong> <strong>Bay</strong> Alliance 2011