Action Plan for the Town of Chatham Ponds
rev 3a report.pdf - Town to Chatham
rev 3a report.pdf - Town to Chatham

You also want an ePaper? Increase the reach of your titles
YUMPU automatically turns print PDFs into web optimized ePapers that Google loves.
<strong>Action</strong> <strong>Plan</strong> <strong>for</strong> <strong>the</strong><br />
<strong>Town</strong> <strong>of</strong> <strong>Chatham</strong> <strong>Ponds</strong><br />
November 2003<br />
EcoLogic, LLC<br />
Atwell Mill Annex, S-2<br />
132 1/2 Albany Street<br />
Cazenovia, NY 13035<br />
Tel. (315) 655-8305<br />
www.ecologicllc.com
Table <strong>of</strong> Contents<br />
1. Introduction and Scope................................................................................................1<br />
2. Nutrients and Eutrophication......................................................................................1<br />
3. Managing Eutrophication............................................................................................3<br />
4. Kettle Pond Ecosystems ...............................................................................................4<br />
5. Sources <strong>of</strong> Data and In<strong>for</strong>mation.................................................................................5<br />
5.1. Current Water Quality Conditions............................................................................5<br />
5.2. Pollutants <strong>of</strong> Concern..............................................................................................6<br />
5.3. Target Concentrations .............................................................................................6<br />
5.4. Acceptable Loads to Meet Targets...........................................................................8<br />
5.5. Point and nonpoint sources <strong>of</strong> nutrients ....................................................................8<br />
5.6. Transport and attenuation from source to ponds ........................................................9<br />
5.7. Strategy to meet targets.........................................................................................10<br />
6. Inventory <strong>of</strong> <strong>Chatham</strong> <strong>Ponds</strong> .....................................................................................10<br />
7. Summary <strong>of</strong> Findings.................................................................................................14<br />
8. Recommendations......................................................................................................16<br />
8.1. Public Education ..................................................................................................16<br />
8.2. Land acquisition ...................................................................................................16<br />
8.3. Bioengineering .....................................................................................................16<br />
8.4. Structural.............................................................................................................16<br />
8.5. Inspection and Monitoring.....................................................................................16<br />
8.6. In-lake Measures ..................................................................................................17<br />
9. Priority <strong>Action</strong>s <strong>for</strong> <strong>the</strong> <strong>Town</strong> <strong>of</strong> <strong>Chatham</strong>.................................................................18<br />
10. References..................................................................................................................19<br />
Appendix A. Summary <strong>of</strong> Regulatory Setbacks and Recommendations <strong>for</strong> Septic Systems in .....<br />
Coastal Areas...................................................................................................20<br />
Appendix B. Summary <strong>of</strong> Pond Management Alternatives......................................................21<br />
Appendix C. Recommended Water Quality Monitoring Program............................................27
List <strong>of</strong> Tables<br />
Page<br />
Table 1. Data Sources Used to Develop <strong>Chatham</strong> <strong>Ponds</strong> <strong>Action</strong> <strong>Plan</strong> ............................... 5<br />
Table 2. Trophic State and Indicator Parameters............................................................. 7<br />
Table 3. Ecoregional Criteria ........................................................................................ 7<br />
Table 4. Status <strong>of</strong> <strong>Chatham</strong> <strong>Ponds</strong>, based on Ecoregional Criteria .................................... 8<br />
Table 5. Summary <strong>of</strong> Physical Characteristics: <strong>Chatham</strong> <strong>Ponds</strong> ..................................... 10<br />
Table 6. Potential <strong>for</strong> Sediment Phosphorus to Enter Photic Zone during Summer .......... 12<br />
Table 7. Summary <strong>of</strong> Trophic State Parameters, <strong>Chatham</strong> <strong>Ponds</strong> ................................... 13<br />
Table 8. Summary <strong>of</strong> Current Water Quality Conditions and Use Attainment ................. 13<br />
Table 9. Nitrogen: Phosphorus Ratios, <strong>Chatham</strong> Freshwater <strong>Ponds</strong> ................................ 15<br />
Table 10. Summary <strong>of</strong> Major Findings and Recommendations <strong>for</strong> <strong>Chatham</strong> <strong>Ponds</strong> ........... 17<br />
List <strong>of</strong> Figures<br />
Page<br />
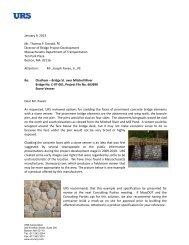
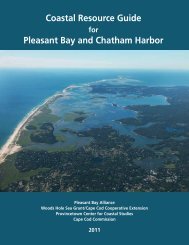
Figure 1. Freshwater <strong>Ponds</strong>, <strong>Town</strong> <strong>of</strong> <strong>Chatham</strong>, MA. ....................................................... 2<br />
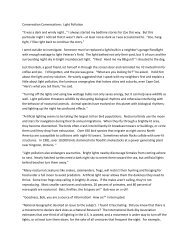
Figure 2. Algal bloom in Perch Pond (left) and clear waters <strong>of</strong> White Pond (right) ............. 3<br />
Figure 3. Aerial photograph <strong>of</strong> Goose Pond illustrating hydrologic isolation <strong>of</strong><br />
kettle ponds..................................................................................................... 4<br />
Figure 4. Maximum Depth and Extent <strong>of</strong> Anoxia ........................................................... 11
<strong>Action</strong> <strong>Plan</strong> <strong>for</strong> <strong>the</strong> <strong>Town</strong> <strong>of</strong> <strong>Chatham</strong> <strong>Ponds</strong><br />
1. Introduction and Scope<br />
This report summarizes <strong>the</strong> water quality and aquatic habitat conditions <strong>of</strong> <strong>the</strong> freshwater ponds<br />
<strong>of</strong> <strong>Chatham</strong>, and recommends measures <strong>for</strong> protection and restoration <strong>of</strong> this valuable resource.<br />
Twenty inland ponds are included in this report; <strong>the</strong> ponds range in size from 0.5 to 16.7 ha (1.2 –<br />
41 acres) and are used <strong>for</strong> aes<strong>the</strong>tic enjoyment, recreational fishing, swimming, and boating.<br />
In July 2003, Ecologic and Stearns & Wheler entered into an agreement with <strong>the</strong> <strong>Town</strong> to<br />
develop an action plan <strong>for</strong> protecting and restoring <strong>the</strong> nutrient-related water quality <strong>of</strong> a total <strong>of</strong><br />
17 freshwater ponds <strong>of</strong> <strong>Chatham</strong>. An additional three ponds, Minister’s Pond, Fox Pond, and<br />
Cranberry (a flooded bog), were added to <strong>the</strong> original scope at <strong>the</strong> request <strong>of</strong> Dr. Robert<br />
Duncanson <strong>of</strong> <strong>the</strong> <strong>Town</strong> <strong>of</strong> <strong>Chatham</strong> Water Quality Laboratory during <strong>the</strong> site visit <strong>of</strong> July 15,<br />
2003. The site visit was an opportunity to complete a visual assessment <strong>of</strong> habitat quality and<br />
land use in <strong>the</strong> ponds’ watersheds. The location <strong>of</strong> <strong>the</strong> ponds within <strong>the</strong> <strong>Town</strong> <strong>of</strong> <strong>Chatham</strong> is<br />
illustrated in Figure 1.<br />
We used existing data describing water quality and aquatic habitat conditions within <strong>the</strong> ponds,<br />
drawing on <strong>the</strong> characterization published in <strong>the</strong> Cape Cod Pond and Lake Atlas <strong>for</strong> eight <strong>of</strong> <strong>the</strong><br />
ponds (Cape Cod Commission Water Resources Office, May 2003). These data were<br />
complemented by additional data available from <strong>the</strong> <strong>Town</strong> <strong>of</strong> <strong>Chatham</strong> Water Quality Laboratory<br />
including results <strong>of</strong> <strong>the</strong> 2001 and 2002 monitoring program. In addition, we reviewed <strong>the</strong><br />
findings <strong>of</strong> <strong>the</strong> qualitative Pond Shoreline Survey Report (Horsley & Witten, February 2003)<br />
developed <strong>for</strong> several ponds in <strong>the</strong> Pleasant Bay Watershed. Stearns & Wheler provided a series<br />
<strong>of</strong> GIS land use maps.<br />
This report defines potential options <strong>for</strong> protection and improvement <strong>of</strong> <strong>the</strong> freshwater ponds <strong>of</strong><br />
<strong>Chatham</strong> and develops a set <strong>of</strong> specific recommendations. The recommendations reflect our<br />
assessment <strong>of</strong> effectiveness (both short-term and long-term), cost, permitting issues, and<br />
recreational impacts. The recommended actions include institutional, technical, and public<br />
education components. Some recommendations are town-wide, while o<strong>the</strong>rs are directed to<br />
specific ponds. An overall implementation strategy is presented that defines priority actions and<br />
sequencing <strong>of</strong> recommendations.<br />
2. Nutrients and Eutrophication<br />
“Lakes seem, on <strong>the</strong> scale <strong>of</strong> years or human life spans, permanent features <strong>of</strong> <strong>the</strong> landscape, but<br />
<strong>the</strong>y are geologically transitory, usually born <strong>of</strong> catastrophe and mature and die quietly and<br />
imperceptibly” (Hutchinson 1957). This <strong>of</strong>ten-cited quote from a classic limnology text provides<br />
excellent context <strong>for</strong> reviewing <strong>the</strong> current and future conditions <strong>of</strong> <strong>the</strong> ponds <strong>of</strong> <strong>Chatham</strong>. The<br />
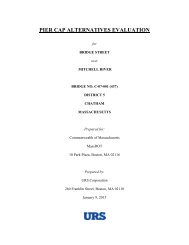
ponds may be arrayed along a continuum from open, clear, water with little visible algal growth<br />
to extremely shallow, productive systems well on <strong>the</strong>ir way to becoming wetlands (Figure 2).<br />
Eutrophication, <strong>the</strong> term <strong>for</strong> both <strong>the</strong> process and <strong>the</strong> effects <strong>of</strong> enrichment <strong>of</strong> surface water<br />
systems (including lakes, ponds, estuaries, and reservoirs), is a major water quality issue. As<br />
aquatic systems become increasingly enriched with plant nutrie nts, organic matter, and silt <strong>the</strong><br />
EcoLogic LLC and 1<br />
November 20, 2003 Rev. 3<br />
Stearns & Wheler LLC
FOX POND<br />
HARWICH<br />
STILLWATER POND<br />
MINISTER'S POND<br />
TROUT POND<br />
PINKWINK POND<br />
CRANBERRY POND<br />
MILL POND<br />
PICKEREL POND<br />
LOVERS LAKE<br />
SCHOOLHOUSE POND<br />
BARCLAY'S POND<br />
CHATHAM<br />
LITTLE POND<br />
EMERY POND<br />
DUANE POND<br />
BLACK POND MID<br />
GOOSE POND<br />
MARY'S POND<br />
BLACK POND EAST<br />
SOUTH POND<br />
RYDER'S POND<br />
BLUE POND<br />
WHITE POND<br />
PERCH POND<br />
ARCHIES POND<br />
BLACK POND WEST<br />
CHRISTOPHER HARDING LANE POND<br />
BEARSES POND<br />
MEADOW VIEW ROAD POND<br />
Data Source: MassGIS .5 Meter Color Orthophoto<br />
1 inch equals 1,500 feet<br />
File Location: D:\GIS Project Folder\Job#\<strong>Chatham</strong>\Freshwater <strong>Ponds</strong>.mxd<br />
Hyannis, Massachusetts<br />
<strong>Town</strong> <strong>of</strong> <strong>Chatham</strong>, MA<br />
FRESHWATER PONDS<br />
11/19/03 FIGURE 1
esult is increased biomass <strong>of</strong> algae and plants, reduced water clarity, and ultimately, a reduction<br />
in volume. Aes<strong>the</strong>tic quality and habitat conditions are degraded; surface waters may lose<br />
suitability <strong>for</strong> recreational uses and water supply as eutrophication proceeds. The composition<br />
and abundance <strong>of</strong> <strong>the</strong> aquatic biota may be altered.<br />
While eutrophication is a natural process, it can be greatly accelerated by human activities. There<br />
are numerous lakes and ponds included in state compendia <strong>of</strong> impaired waters; most are listed<br />
due to excessive nutrient inputs from nonpoint sources such as agricultural run<strong>of</strong>f and (less<br />
frequently) point sources.<br />
Figure 2. Algal bloom in Perch Pond (left) and clear waters <strong>of</strong> White Pond (right).<br />
3. Managing Eutrophication<br />
Water resources managers focus on identifying and controlling <strong>the</strong> sources <strong>of</strong> nutrients, organic<br />
material, and silt to aquatic ecosystems in an ef<strong>for</strong>t to slow down <strong>the</strong> eutrophication process. Two<br />
important processes have been quantified <strong>for</strong> many aquatic systems: (1) <strong>the</strong> relationship between<br />
watershed activities and loading, and (2) <strong>the</strong> relationship between loading and resultant water<br />
quality conditions. For <strong>the</strong> first relationship, scientists, engineers, and planners have quantified<br />
nutrient run<strong>of</strong>f from various conditions <strong>of</strong> land use and population density. For <strong>the</strong> second,<br />
limnologists and oceanographers have determined <strong>the</strong> physical and hydrologic features such as<br />
depth and water residence time that contribute to assimilative capacity. These relationships <strong>for</strong>m<br />
<strong>the</strong> basis <strong>for</strong> defining an acceptable loading to aquatic systems to meet water quality objectives.<br />
Ma<strong>the</strong>matical models <strong>of</strong> <strong>the</strong> relationships between external loading and water quality response<br />
have been developed to enable mangers to predict <strong>the</strong> effectiveness <strong>of</strong> control actions. These<br />
models vary greatly in complexity and sophistication. However, all <strong>of</strong> <strong>the</strong> models follow a<br />
systematic process as outlined below:<br />
‣ Define existing water quality and habitat conditions and determine whe<strong>the</strong>r desired uses<br />
are being met.<br />
‣ Identify pollutant(s) responsible <strong>for</strong> degraded water quality and/or habitat conditions.<br />
‣ Define targets (defined as ambient concentrations <strong>of</strong> pollutant(s) that will support desired<br />
use).<br />
‣ Quantify acceptable loads, specific to each water body, which will meet target conditions.<br />
‣ Identify contributing point and nonpoint sources <strong>of</strong> pollution.<br />
‣ Quantify transport and attenuation from source to water body.<br />
‣ Develop a strategy <strong>for</strong> source reductions or o<strong>the</strong>r measures to meet targets.<br />
Phosphorus is most <strong>of</strong>ten <strong>the</strong> limiting nutrient <strong>for</strong> primary productivity and algal biomass in<br />
inland lakes <strong>of</strong> <strong>the</strong> Nor<strong>the</strong>ast. This finding has focused lake restoration and management<br />
EcoLogic LLC and 3<br />
November 20, 2003 Rev. 3<br />
Stearns & Wheler LLC
techniques on controlling <strong>the</strong> concentration <strong>of</strong> phosphorus and has led to significant<br />
improvements in many systems. However, Cooke et al. (1993) point out that many lakes are<br />
shallow, with extensive wetland and littoral zones and macrophyte communities. The complexity<br />
<strong>of</strong> nutrient flux and food web interactions at <strong>the</strong> sediment-water interface in highly productive<br />
shallow regions <strong>of</strong> lakes and ponds cannot be ignored. Nutrient cycling and biological<br />
interactions in shallow weedy sections <strong>of</strong> <strong>the</strong> ponds may contribute to maintaining elevated<br />
nutrient levels and undesirable plant growth long after external loading controls have been<br />
implemented. This is an important consideration <strong>for</strong> many <strong>of</strong> <strong>the</strong> kettle ponds <strong>of</strong> <strong>Chatham</strong>.<br />
While phosphorus is <strong>the</strong> key to managing eutrophication <strong>of</strong> <strong>the</strong> inland ponds, nitrogen is <strong>the</strong><br />
limiting nutrient <strong>for</strong> primary production <strong>for</strong> <strong>the</strong> coastal ecosystem. Nitrogen enrichment has<br />
resulted in degradation <strong>of</strong> estuarine and marine water quality and habitat conditions, and<br />
wastewater is a major source <strong>of</strong> nitrogen. Scientists and regulators from <strong>the</strong> federal EPA, state<br />
DEP, academic community, Cape Cod Commission, and municipalities used a systematic process<br />
to define <strong>the</strong> need <strong>for</strong> and extent <strong>of</strong> reductions in nitrogen loading (Massachusetts Department <strong>of</strong><br />
Environmental Protection 2003 “The Massachusetts Estuaries Project Embayment Restoration<br />
and Guidance <strong>for</strong> Implementation Strategies”). Findings <strong>of</strong> this analysis are now being<br />
incorporated into land use and facilities decisions throughout Cape Cod.<br />
4. Kettle Pond Ecosystems<br />
The ponds <strong>of</strong> Cape Cod are kettle ponds, <strong>for</strong>med as depressions left behind by ice blocks as <strong>the</strong><br />
glacial ice retreated between 14,000 and 17,000 years ago. According to Portnoy et al (2001),<br />
while <strong>the</strong> ponds <strong>of</strong> Cape Cod have a common glacial origin, <strong>the</strong>ir subsequent evolution differs<br />
based on <strong>the</strong> depth <strong>of</strong> <strong>the</strong> original ice block, landscape position relative to sea level, and <strong>the</strong><br />
texture (particle size) <strong>of</strong> <strong>the</strong> soils in <strong>the</strong> ponds’ watersheds. Cultural effects are also to be added<br />
to this list; <strong>the</strong> ponds <strong>of</strong> Cape Cod are influenced by <strong>the</strong> amount and type <strong>of</strong> development in <strong>the</strong><br />
watershed, invasions <strong>of</strong> exotic species, application <strong>of</strong> lime to raise <strong>the</strong> naturally low pH <strong>of</strong> <strong>the</strong><br />
waters, and fisheries management practices.<br />
Unlike most lakes and ponds, kettle ponds do not have prominent tributary streams (inlets) and<br />
outlets (Figure 3). Groundwater seepage and direct precipitation, ra<strong>the</strong>r than surface water flows,<br />
are <strong>the</strong> source <strong>of</strong> water to <strong>the</strong> kettle ponds. The quality <strong>of</strong> <strong>the</strong> water in <strong>the</strong> ponds, <strong>the</strong>re<strong>for</strong>e, is<br />
directly affected by <strong>the</strong> quality <strong>of</strong> <strong>the</strong> groundwater resource.<br />
Figure 3. Aerial photograph <strong>of</strong><br />
Goose Pond illustrating hydrologic<br />
isolation <strong>of</strong> kettle ponds.<br />
The lack <strong>of</strong> defined inlets and outlet <strong>for</strong> most ponds has<br />
some important implications <strong>for</strong> <strong>the</strong> cycling <strong>of</strong> nutrients<br />
and organic material. Nitrogen and phosphorus enter <strong>the</strong><br />
ponds primarily as dissolved nutrients where <strong>the</strong>y are<br />
incorporated into biomass. Water leaves <strong>the</strong> ponds<br />
through groundwater seepage and evaporation.<br />
Particulate biomass consequently remains in <strong>the</strong> ponds,<br />
and <strong>the</strong> nutrients continue to cycle through <strong>the</strong> food web.<br />
<strong>Ponds</strong> <strong>the</strong>re<strong>for</strong>e become more productive over time; this<br />
natural phenomenon may be more important <strong>for</strong> kettle<br />
ponds where <strong>the</strong>re is little opportunity <strong>for</strong> particulate<br />
material to leave <strong>the</strong> system. The Cape Cod Commission<br />
compiled dissolved oxygen (DO) measurements in <strong>the</strong><br />
lower waters <strong>of</strong> 41 kettle ponds; data were from 1948<br />
EcoLogic LLC and 4<br />
November 20, 2003 Rev. 3<br />
Stearns & Wheler LLC
and 2001. Comparison <strong>of</strong> <strong>the</strong> data revealed that 76% <strong>of</strong> <strong>the</strong> measurements were lower in 2001<br />
than 1948. These data provide strong evidence <strong>of</strong> an increasing level <strong>of</strong> productivity in <strong>the</strong> ponds<br />
over <strong>the</strong> intervening five decades (Cape Cod Commission, May 2003 p. 46).<br />
5. Sources <strong>of</strong> Data and In<strong>for</strong>mation<br />
5.1. Current Water Quality Conditions<br />
Un<strong>for</strong>tunately, <strong>the</strong>re are some data gaps that preclude completing an analysis <strong>for</strong> <strong>the</strong> inland ponds<br />
that is completely parallel to that outlined in Section 3 (managing eutrophication). Recent data<br />
are available to complete <strong>the</strong> first task, defining current water quality and habitat conditions. The<br />
<strong>Town</strong> <strong>of</strong> <strong>Chatham</strong> Water Quality Laboratory, under <strong>the</strong> direction <strong>of</strong> Dr. Robert Duncanson, has<br />
conducted a sampling program <strong>of</strong> 18 ponds during <strong>the</strong> summers <strong>of</strong> 2000, 2001 and 2002 and<br />
2003. Trophic status indicators (nutrients, chlorophyll, Secchi disk transparency, and<br />
temperature/dissolved oxygen pr<strong>of</strong>iles) are measured along with pH, alkalinity, and color.<br />
Shoreline habitat was evaluated <strong>for</strong> five <strong>Chatham</strong> ponds within <strong>the</strong> Pleasant Bay Area <strong>of</strong> Critical<br />
Environmental Concern by Horsley and Witten Inc. (2003). A visual survey was conducted in<br />
July 2003 as part <strong>of</strong> this investigation. In addition, limited historical data are available <strong>for</strong> several<br />
<strong>of</strong> <strong>the</strong> larger ponds.<br />
The Cape Cod Commission Water Resources Office published <strong>the</strong> Cape Cod Pond and Lake<br />
Atlas in May 2003; this document presents a summary and analysis <strong>of</strong> water quality status <strong>of</strong><br />
eight <strong>of</strong> <strong>the</strong> <strong>Chatham</strong> ponds. The summaries provide an overview, indicating location, <strong>the</strong> nature<br />
<strong>of</strong> <strong>the</strong> shoreline, and predominant land uses. The fish community and stocking activities are<br />
described. Results <strong>of</strong> <strong>the</strong> late August 2001 snapshot sampling program are tabulated <strong>for</strong> 17<br />
ponds; <strong>the</strong>se results are interpreted with respect to whe<strong>the</strong>r ponds are considered impacted as<br />
indicated by concentrations <strong>of</strong> chlorophyll-a, phosphorus, and nitrogen.<br />
The <strong>Town</strong> monitors several bathing beaches at <strong>the</strong> inland ponds <strong>for</strong> <strong>the</strong> presence and abundance<br />
<strong>of</strong> indicator bacteria. Finally, <strong>the</strong> <strong>Town</strong> <strong>of</strong> <strong>Chatham</strong> Water Quality Laboratory tracks water<br />
quality complaints from <strong>the</strong> public. The various data sources <strong>for</strong> each <strong>of</strong> <strong>the</strong> ponds are<br />
summarized in Table 1.<br />
Table 1<br />
Data Sources Used to Develop <strong>Chatham</strong> <strong>Ponds</strong> <strong>Action</strong> <strong>Plan</strong><br />
Pond<br />
Black Pond-mid<br />
Black Pond-west<br />
Black Pond-east<br />
Blue Pond<br />
Emery Pond<br />
Barclay Pond<br />
Goose Pond<br />
Lovers Lake<br />
Historical<br />
Data (pre<br />
1990)<br />
Pleasant<br />
Bay ACEC<br />
Assessment<br />
<strong>Chatham</strong><br />
Water<br />
Quality<br />
Monitoring<br />
Program<br />
x<br />
x<br />
Cape Cod<br />
Commission<br />
Atlas :<br />
description<br />
Bathing<br />
beach<br />
bacteria<br />
testing<br />
Visual<br />
Assessment<br />
July 2003<br />
x x x<br />
x<br />
x x x x<br />
x<br />
x x x x x<br />
x x x x x<br />
x<br />
x<br />
EcoLogic LLC and 5<br />
November 20, 2003 Rev. 3<br />
Stearns & Wheler LLC
Pond<br />
Historical<br />
Data (pre<br />
1990)<br />
Pleasant<br />
Bay ACEC<br />
Assessment<br />
<strong>Chatham</strong><br />
Water<br />
Quality<br />
Monitoring<br />
Program<br />
Cape Cod<br />
Commission<br />
Atlas :<br />
description<br />
Bathing<br />
beach<br />
bacteria<br />
testing<br />
Visual<br />
Assessment<br />
July 2003<br />
Mill Pond<br />
x x x x x<br />
Mary's Pond<br />
x<br />
x<br />
Minister’s Pond<br />
x<br />
x<br />
Perch Pond<br />
x<br />
x<br />
Pickerel Pond<br />
x<br />
x<br />
Ryder Pond x x<br />
Schoolhouse<br />
Pond<br />
x x x x x<br />
Stillwater Pond<br />
x x x x x<br />
Trout Pond<br />
x<br />
x<br />
White Pond x x x x x<br />
Cranberry<br />
(flooded bog)<br />
x<br />
Fox Pond x x<br />
5.2. Pollutants <strong>of</strong> Concern<br />
The second task, identifying pollutants, is relatively straight<strong>for</strong>ward. The scientific literature and<br />
o<strong>the</strong>r pond studies have highlighted <strong>the</strong> importance <strong>of</strong> phosphorus in regulating primary<br />
productivity <strong>of</strong> <strong>the</strong> inland ponds. Monitoring data confirm that concentrations <strong>of</strong> nitrogen in <strong>the</strong><br />
<strong>Town</strong>’s inland ponds exceed thresholds <strong>of</strong> saturation.<br />
An additional water quality issue is mercury levels. The naturally acidic environment in <strong>the</strong> Cape<br />
Cod kettle ponds is correlated with elevated mercury concentration in fish tissue. According to<br />
<strong>the</strong> Cape Cod Commission, additional testing <strong>of</strong> fish <strong>for</strong> mercury content is recommended (Cape<br />
Cod Commission, Pond and Lake Atlas, May 2003 pg. 39).<br />
5.3. Target Concentrations<br />
Defining target concentrations to protect designated uses is <strong>the</strong> third task. Eutrophication, defined<br />
as enrichment <strong>of</strong> lakes and ponds with nutrients and <strong>the</strong> effects <strong>of</strong> this enrichment, is a<br />
continuum. Lakes and ponds progress from a nutrient-poor, clear water state (oligotrophic)<br />
through an intermediate state <strong>of</strong> higher biological productivity (mesotrophic) and eventually to a<br />
nutrient rich condition <strong>of</strong> very high biological productivity (eutrophic). Hypereutrophic lakes are<br />
turbid lakes, closest to <strong>the</strong> wetland status. However, lakes may exist in a trophic equilibrium <strong>for</strong><br />
decades or centuries. When human activities accelerate <strong>the</strong> eutrophication process it is termed<br />
cultural eutrophication. Limnologists and lake mangers have developed guidelines to define <strong>the</strong><br />
transition between trophic states based on phosphorus, water clarity, chlorophyll-a, and deep<br />
water dissolved oxygen concentrations (Table 2). However, assigning a lake or pond to one<br />
category still requires pr<strong>of</strong>essional judgment considering <strong>the</strong> cumulative evidence <strong>of</strong> water<br />
quality conditions and <strong>the</strong> level <strong>of</strong> productivity.<br />
EcoLogic LLC and 6<br />
November 20, 2003 Rev. 3<br />
Stearns & Wheler LLC
Table 2<br />
Trophic State and Indicator Parameters<br />
Oligotrophic Mesotrophic Eutrophic Hypereutrophic<br />
Average Total<br />
100<br />
Phosphorus, upper<br />
waters (µg/l)<br />
Summer chlorophyll-a, 25<br />
upper waters (µg/l)<br />
Peak chlorophyll-a (µg/l) 75<br />
Average Secchi disk >6 6-3 3-1.5 3 3-1.5 1.5-0.7
Table 4<br />
Status <strong>of</strong> <strong>Chatham</strong> <strong>Ponds</strong>, based on Ecoregional Criteria<br />
Pond<br />
Impacted Criteria (Affected by Human Activities)<br />
Chlor >1.7 µg/l Total N > 0.31 mg/l Total P > 10 µg/l<br />
Barclay Pond Impacted Impacted Impacted<br />
Black Pond-east Impacted Impacted Impacted<br />
Black Pond- west Impacted Impacted Impacted<br />
Black Pond – mid Impacted Impacted Impacted<br />
Blue Pond Impacted Impacted Impacted<br />
Emery Pond Impacted Impacted Impacted<br />
Goose Pond Impacted At Risk Unimpacted<br />
Lovers Lake Impacted Impacted Impacted<br />
Mary’s Pond At Risk Impacted Impacted<br />
Mill Pond Impacted Impacted Impacted<br />
Perch Pond Impacted Impacted Impacted<br />
Pickerel Pond Impacted Impacted Impacted<br />
Ryder’s Pond Impacted Impacted Impacted<br />
Schoolhouse Pond Impacted At Risk Impacted<br />
Stillwater Pond Impacted Impacted Impacted<br />
Trout Pond Impacted Impacted Impacted<br />
White Pond Impacted Impacted At Risk<br />
Source: <strong>Chatham</strong> 2001 PALS Water Quality Snapshot Summary, Appended to Cape Cod <strong>Ponds</strong> and Lake<br />
Atlas, May 2003<br />
5.4. Acceptable Loads to Meet Targets<br />
Additional research and analysis are needed to calculate an acceptable external load <strong>of</strong><br />
phosphorus to <strong>the</strong> ponds that would protect water quality conditions. The kettle ponds <strong>of</strong> Cape<br />
Cod present a unique challenge. Standard limnological models have been developed to quantify<br />
<strong>the</strong> relationship between external loading and in-lake concentration as a function <strong>of</strong> mean depth<br />
and water residence time. These standard models were developed based on empirical<br />
observations <strong>of</strong> a large number <strong>of</strong> lakes and ponds, with defined inlets and outlets. Because kettle<br />
ponds are fed by groundwater seepage, detailed research and monitoring are needed to quantify<br />
water residence time; <strong>the</strong>se calculations have not been completed <strong>for</strong> <strong>the</strong> <strong>Chatham</strong> ponds.<br />
5.5. Point and nonpoint sources <strong>of</strong> nutrients<br />
Land use data are available <strong>for</strong> <strong>the</strong> <strong>Town</strong>, including <strong>the</strong> number and location <strong>of</strong> residences. Once<br />
<strong>the</strong> contributing area <strong>of</strong> groundwater flow into each pond is delineated, <strong>the</strong>se data can be used to<br />
help quantify <strong>the</strong> potential contribution <strong>of</strong> septic effluent to <strong>the</strong> ponds. In general, <strong>the</strong> external<br />
sources <strong>of</strong> phosphorus to <strong>the</strong> <strong>Chatham</strong> <strong>Ponds</strong> include:<br />
o groundwater influx (natural background)<br />
o groundwater influenced by wastewater disposal (sewage plumes),<br />
o run<strong>of</strong>f from surfaces such as roadways<br />
o atmospheric deposition,<br />
o shoreline erosion,<br />
o swimmers,<br />
o wildlife (gulls, waterfowl, deer etc).<br />
In addition to <strong>the</strong> external sources, phosphorus cycles from <strong>the</strong> sediments, particularly in <strong>the</strong><br />
deeper ponds subject to seasonal anoxia.<br />
EcoLogic LLC and 8<br />
November 20, 2003 Rev. 3<br />
Stearns & Wheler LLC
5.6. Transport and attenuation from source to ponds<br />
Most <strong>of</strong> <strong>the</strong> sources listed above are direct inputs to <strong>the</strong> ponds: wildlife, swimmers, stormwater<br />
run<strong>of</strong>f, and shoreline erosion. One source, however, is <strong>the</strong> subject <strong>of</strong> investigation and debate.<br />
The extent to which phosphorus in septic effluent can reach surface waters is an issue <strong>of</strong> great<br />
importance to many communities. Research and monitoring indicates that subsurface phosphorus<br />
transport is influenced by depth to groundwater, soil texture, pH, geology, and groundwater<br />
quality, as well as by <strong>the</strong> nature <strong>of</strong> <strong>the</strong> on-site wastewater disposal systems (notably age, loading<br />
history, and maintenance).<br />
In general, phosphorus is considered relatively immobile in <strong>the</strong> subsurface environment;<br />
environmental policy has focused largely on nitrogen transport. Phosphorus transport through<br />
groundwater to surface waters has been documented; <strong>for</strong> example, phosphorus associated with <strong>the</strong><br />
sewage plume from <strong>the</strong> Massachusetts Military Reservation on Cape Cod is reaching Ashumet<br />
Pond (McCobb et al 2003). Phosphorus from septic systems may reach surface waters when<br />
intervening distances and travel times are short, when <strong>the</strong> groundwater environment is reducing<br />
(anoxic), or when sites <strong>for</strong> sorption <strong>of</strong> phosphorus onto aluminum and iron oxides are already<br />
saturated with phosphorus (Portnoy et al 2001). The Ashumet Pond investigation by USGS<br />
documented that phosphorus can desorb from subsurface soils exposed to uncontaminated<br />
groundwater with low pH (McCobb et al. 2003). This implies that phosphorus from on-site<br />
systems remains a reservoir in <strong>the</strong> soil that may be slowly mobilized and transported to <strong>the</strong> ponds<br />
along with groundwater.<br />
Controlled experiments by Cogger et al (1988) examined <strong>the</strong> movement <strong>of</strong> nutrients and bacteria<br />
from septic systems installed in <strong>the</strong> sandy soils <strong>of</strong> a coastal barrier island. They reported that<br />
phosphorus was most likely to be mobile in wet, sandy soils, and that both loading rate and water<br />
table location affected phosphorus concentrations in <strong>the</strong> groundwater surrounding <strong>the</strong> leach field.<br />
Data from this investigation were also consistent with two processes <strong>for</strong> adsorption occurring: a<br />
fast reaction and a slow reaction.<br />
The ponds <strong>of</strong> <strong>Chatham</strong> are situated in sandy soils, and <strong>the</strong> surrounding land areas have a variable<br />
depth to groundwater. Background pH is low, averaging 5.5 (McCobb et al. 2003). The sandy<br />
soils provide abundant iron and aluminum hydroxides <strong>for</strong> phosphorus adsorption. The reaction <strong>of</strong><br />
soluble reactive phosphorus with sandy soil is described by two processes: a fast and reversible<br />
adsorption reaction on <strong>the</strong> surface <strong>of</strong> aluminum and iron oxides and a slow, diffusion-controlled<br />
process where <strong>the</strong> phosphorus ei<strong>the</strong>r precipitates with aluminum or iron, or diffuses into<br />
micropores and becomes adsorbed to surfaces deep in <strong>the</strong> soil matrix (Shoumans and Breeuwsma<br />
1997).<br />
It appears that <strong>the</strong> soils <strong>of</strong> <strong>Chatham</strong> have capacity to bind phosphorus in groundwater based on<br />
<strong>the</strong> chemical composition. However, phosphorus removal is not permanent. Under certain<br />
conditions <strong>of</strong> groundwater chemistry, phosphorus adsorbed to <strong>the</strong> surface aluminum and iron<br />
hydroxides may desorb and move with <strong>the</strong> groundwater towards <strong>the</strong> kettle ponds. Groundwater<br />
pH on Cape Cod is within <strong>the</strong> range where this desorption reaction will occur. Phosphorus<br />
movement from subsurface soils would be exacerbated by conditions such as high organic<br />
loading that contribute to microbial activity and de-oxygenation <strong>of</strong> <strong>the</strong> groundwater resource.<br />
Regulatory programs <strong>for</strong> septic systems existing in similar environments to <strong>the</strong> Cape Cod area<br />
show a variety <strong>of</strong> setback requirements, as summarized in Appendix A. In addition to setbacks,<br />
<strong>the</strong>re is great interest in use <strong>of</strong> alternative technologies, some <strong>of</strong> which show excellent<br />
phosphorus removal capabilities. The Massachusetts Alternative Septic Systems Test Center and<br />
EcoLogic LLC and 9<br />
November 20, 2003 Rev. 3<br />
Stearns & Wheler LLC
<strong>the</strong> Barnstable County Department <strong>of</strong> Health are presently investigating alternative technologies<br />
that would be applicable to <strong>the</strong> <strong>Town</strong> <strong>of</strong> <strong>Chatham</strong>. Results are not yet published, but<br />
commercially available technologies indicate effluent reductions in total phosphorus from 60-<br />
85% (http://www.rucksystems.com/treatment/) and close to 100% in soluble reactive phosphorus<br />
(SRP) (http://www.lombardoassociates.com/phosrid.shtml).<br />
5.7. Strategy to meet targets<br />
Given <strong>the</strong> nature <strong>of</strong> <strong>the</strong> kettle ponds and <strong>the</strong> sources <strong>of</strong> phosphorus to <strong>the</strong> <strong>Chatham</strong> <strong>Ponds</strong>, <strong>the</strong>re<br />
are no easy answers to long-term water quality protection and improvement. Strategies fall into<br />
several categories: reducing <strong>the</strong> inputs <strong>of</strong> nutrients and sediment, altering internal cycling,<br />
increasing <strong>the</strong> output, and/or mitigating <strong>the</strong> symptoms <strong>of</strong> eutrophication. Management options<br />
<strong>for</strong> controlling algal growth typically differ from those to control <strong>the</strong> growth <strong>of</strong> aquatic plants and<br />
macroalgae (macrophytes). Feasible alternatives <strong>for</strong> protection and restoration <strong>of</strong> <strong>the</strong> <strong>Chatham</strong><br />
<strong>Ponds</strong> are summarized in Appendix B.<br />
6. Inventory <strong>of</strong> <strong>Chatham</strong> <strong>Ponds</strong><br />
The <strong>Chatham</strong> ponds exhibit a range <strong>of</strong> physical characteristics (Table 5).<br />
Pond<br />
Max.<br />
Depth<br />
(m)<br />
Table 5<br />
Summary <strong>of</strong> Physical Characteristics: <strong>Chatham</strong> <strong>Ponds</strong><br />
Surface<br />
Area<br />
(ha)<br />
# <strong>of</strong><br />
Res 1<br />
Public<br />
Beach<br />
pH<br />
(standard<br />
units)<br />
Surface Water Quality<br />
(2000 – 2002 Averages)<br />
Alk. Temp Secc<br />
(mg/l) Diff. 2 hi<br />
(deg C)<br />
Color<br />
(m)<br />
Black -mid 3.2 2 9 6.9 17.8 2.0 1.0 Green<br />
Black -west 2.3 0.7 2 6.7 6.7 1.0 1.4 Brown<br />
Black -east 5.5 2 12 6.4 5.7 7.0 2.2 Tea<br />
Blue Pond 3 1.2 0 6.7 6.6 1.0 2.3 Green<br />
Emery Pond 6.4 5.7 32 7.4 11.2 3.5 2.3 Clear<br />
Barclay Pond 8.5 1.2 1 6.5 5.7 9.5 2.7 Tea<br />
Goose Pond 16 16.7 8 Yes 6.6 2.6 4.0 5.5 Blue/G<br />
Lovers Lake 10.4 15.2 38 8.7 19 7.0 1.5 Grn/Br<br />
Mill Pond 4.9 9.5 22 6.6 11.3 1.5 1.6 Brown<br />
Mary's Pond 3 1.7 6.3 5.0 0.7 B Tea<br />
Perch Pond 1.7 2.2 20 6.7 26.0 0.4 1.0 Tea<br />
Pickerel Pond 1.7 0.5 16 5.8 1.7 0.2 B Clear<br />
Ryder Pond 2.4 2.3 11 6.2 2.3 0.3 B Brown<br />
Schoolhouse<br />
14 7.5 18 Yes 6.5 4.7 7.8 4.6 Green<br />
Pond<br />
Stillwater Pond 15.5 7.6 24 8.0 17.0 10.4 1.9 Green<br />
Trout Pond 5 2 15 5.5 1.1 0.4 4.1 Clear<br />
White Pond 16.8 16.3 50 Yes 9.1 9.1 8.5 3.6 Green<br />
B=Bottom<br />
1<br />
Number <strong>of</strong> residences with 300 ft <strong>of</strong> shoreline<br />
2 Maximum temperature difference (deg C) between surface and bottom samples<br />
<strong>Ponds</strong> deeper than about 5 m exhibit some degree <strong>of</strong> <strong>the</strong>rmal stratification during <strong>the</strong> summer.<br />
Bottom waters isolated from <strong>the</strong> atmosphere become depleted <strong>of</strong> oxygen as <strong>the</strong> microbial<br />
community decomposes organic material. Once <strong>the</strong> lower waters become anoxic (operationally<br />
EcoLogic LLC and 10<br />
November 20, 2003 Rev. 3<br />
Stearns & Wheler LLC
defined as DO < 1 mg/l) phosphorus adsorbed to <strong>the</strong> lake bottom sediments become soluble and<br />
diffuses into <strong>the</strong> overlying water. As ponds become more productive, anoxia is measured higher<br />
in <strong>the</strong> water column. This relationship <strong>for</strong> <strong>the</strong> <strong>Chatham</strong> ponds is displayed in Figure 4. The axes<br />
are maximum depth <strong>of</strong> ponds, and maximum percent <strong>of</strong> <strong>the</strong> water column affected by anoxia<br />
(from <strong>the</strong> 2000 – 2002 data sets). Note that two ponds, Black Pond-mid and Stillwater Pond, plot<br />
outside <strong>of</strong> <strong>the</strong> general pattern. The extent <strong>of</strong> anoxia in <strong>the</strong>se ponds is higher than <strong>the</strong> o<strong>the</strong>r ponds.<br />
Schoolhouse Pond, in contrast, has less anoxia, indicating higher water quality. The shallowest<br />
ponds (Perch, Pickerel, Black-west, Ryder, Blue, Mary’s, Mill and Trout <strong>Ponds</strong>) do not develop<br />
oxygen depletion in <strong>the</strong> lower waters. Soluble phosphorus entering <strong>the</strong>se ponds with <strong>the</strong><br />
groundwater will become incorporated into <strong>the</strong> biota.<br />
<strong>Ponds</strong> deep enough to stratify and productive enough to experience seasonal anoxia have elevated<br />
concentrations <strong>of</strong> phosphorus in <strong>the</strong> lower waters. In some lakes, wind-induced mixing and<br />
internal waves (seiches) may entrain <strong>the</strong> phosphorus-rich water into <strong>the</strong> upper sunlit layer where<br />
<strong>the</strong> nutrient can support algal growth (<strong>the</strong> photic zone) during <strong>the</strong> summer stratified period.<br />
White Pond<br />
Goose Pond<br />
Stillwater Pond<br />
Schoolhouse Pond<br />
Lovers Lake<br />
Figure 4<br />
Maximum Depth and Extent <strong>of</strong> Anoxia<br />
Barclay Pond<br />
Emery Pond<br />
Black Pond-east<br />
Max Extent <strong>of</strong> Anoxia (m)<br />
Max Depth (m)<br />
Trout Pond<br />
Mill Pond<br />
Black Pond-mid<br />
Mary's Pond<br />
Blue Pond<br />
Ryder Pond<br />
Black Pond-west<br />
Pickerel Pond<br />
Perch Pond<br />
0 2 4 6 8 10 12 14 16 18<br />
Depth (m)<br />
One measure <strong>of</strong> <strong>the</strong> probability <strong>of</strong> mixing between <strong>the</strong> upper and lower waters is <strong>the</strong> Osgood<br />
Index, named <strong>for</strong> <strong>the</strong> limnologist who developed an empirical relationship between lakes’ surface<br />
area and depth, and <strong>the</strong> stability <strong>of</strong> <strong>the</strong> water column. Small, deep lakes are less likely to have<br />
wind-induced mixing <strong>of</strong> deep waters into <strong>the</strong> photic zone. Conversely, shallower lakes with larger<br />
surface area are more susceptible to wind mixing and phosphorus released from sediments may<br />
become entrained into <strong>the</strong> upper waters and available to support algal growth during <strong>the</strong> stratified<br />
EcoLogic LLC and 11<br />
November 20, 2003 Rev. 3<br />
Stearns & Wheler LLC
period (Osgood 1988). <strong>Ponds</strong> with very low indices (less than approximately 4) are polymictic ,<br />
exhibiting only ephemeral stratification. As <strong>the</strong> index increase, so does stability <strong>of</strong> <strong>the</strong> water<br />
column. <strong>Ponds</strong> with indices greater than about 20 are very stable; and would tend to mix later in<br />
<strong>the</strong> fall. Intermediate lakes would be susceptible to mixing <strong>of</strong> hypolimnetic waters during strong<br />
wind events; <strong>the</strong>se ponds may destratify earlier in <strong>the</strong> fall when light and temperature conditions<br />
would support an algal bloom.<br />
Several <strong>of</strong> <strong>the</strong> <strong>Chatham</strong> <strong>Ponds</strong> are somewhat susceptible to this internal phosphorus loading<br />
during summer as summarized in Table 6. However, all <strong>the</strong> <strong>Chatham</strong> kettle ponds mix throughout<br />
<strong>the</strong> water column in <strong>the</strong> fall, as <strong>the</strong> waters cool and <strong>the</strong> <strong>the</strong>rmal gradient (and thus density<br />
differences) between <strong>the</strong> upper and lower layers breaks down. Phosphorus in <strong>the</strong> lower waters is<br />
distributed throughout <strong>the</strong> water column and is available <strong>for</strong> algal uptake given favorable<br />
conditions <strong>of</strong> light and temperature.<br />
Table 6<br />
Potential <strong>for</strong> Sediment Phosphorus to Enter Photic Zone during Summer<br />
Pond<br />
Mean<br />
Depth (m)<br />
Surface<br />
Area<br />
(ha)<br />
Anoxia<br />
Maximum TP,<br />
lower waters<br />
* µg/l<br />
Black -east N/A 2 Yes 88 N/A<br />
Osgood<br />
Index<br />
Probability <strong>of</strong><br />
Entrainment during<br />
stratified period<br />
Emery 3 5.7 Yes 246 12.6 Moderate<br />
Barclay N/A 1.2 Yes 89 N/A<br />
Lovers Lake 5 15.2 Yes 173 12.8 Moderate<br />
Schoolhouse 7.7 7.5 Yes 56 28.2 Low<br />
Stillwater 6 7.6 Yes 326 21.8 Low<br />
Goose Pond 7.6 16.7 Yes 13 18.6 Low<br />
White Pond 7 16.3 Yes 223 17.3 Low<br />
*Based on 2000 – 2002 monitoring data, <strong>Town</strong> <strong>of</strong> <strong>Chatham</strong> Water Quality Laboratory<br />
The water quality and aquatic habitat data collected during <strong>the</strong> 2001 – 2002 field investigations<br />
indicates that <strong>the</strong> <strong>Chatham</strong> <strong>Ponds</strong> are in various stages <strong>of</strong> eutrophication. While <strong>the</strong> data are<br />
somewhat limited, representing few sampling points, <strong>the</strong>y do provide a basis <strong>for</strong> making an<br />
assessment <strong>of</strong> trophic state using <strong>the</strong> standard indicators described in Table 2. The final column in<br />
Table 7 represents a pr<strong>of</strong>essional judgment <strong>of</strong> trophic state.<br />
EcoLogic LLC and 12<br />
November 20, 2003 Rev. 3<br />
Stearns & Wheler LLC
Pond<br />
Table 7<br />
Summary <strong>of</strong> Trophic State Parameters, <strong>Chatham</strong> <strong>Ponds</strong><br />
Average<br />
TP (µg/l)<br />
Surface Water Data, 2001 – 2002<br />
(2000 data included where available A )<br />
Average<br />
chlor<br />
(µg/l)<br />
Max<br />
chlor<br />
(µg/l)<br />
Range <strong>of</strong> Secchi<br />
Disk transparency<br />
(meters)<br />
Lower<br />
Water<br />
DO,<br />
% sat<br />
Trophic<br />
State *<br />
Black Pond-mid 44 12.6 19.0 0.8-1.29 20 E<br />
Black Pond-west 22 20.4 32.0 1.9-2.3 80 E<br />
Black Pond-east 28 A 5.7 A 7.1 A 1.8-2.7 20 E<br />
Blue Pond 17 2.3 2.4 1.9 - 2.9 100 M<br />
Emery Pond 27 A 6.7 A 22.0 A 0.5 - 4.5 0 E<br />
Barclay Pond 17 3.3 3.3 2.4-3.0 0 M<br />
Goose Pond 12 A 1.8 A 2.4 A 4.4 - 8.1 40 M<br />
Lovers Lake 37 A 21.2 A 47.0 A 0.9 - 1.6 0 E<br />
Mill Pond 28 A 10.0 A 14.1 A 0.9 - 2.0 30 M/E<br />
Mary's Pond 19 2.0 2.8 Bottom 80 M<br />
Perch Pond 61 13.1 19.0 0.8 -1.3 20 E<br />
Pickerel Pond 22 2.6 2.6 Bottom 100 M<br />
Ryders Pond 27 4.3 5.7 Bottom 80 M/E<br />
Schoolhouse 14 A 2.9 A 4.2 A ~4 40 M<br />
Stillwater Pond 29 A 22.4 A 47.0 A 0.6 - 3.0 0 E<br />
Trout Pond 15 2.0 2.5 3.6 - Bottom 0 M<br />
White Pond 30 A 3.5 A 9.5 A 2.8 - 4.6 30 M<br />
A Includes 2000 data<br />
E=eutrophic; M-mesotrophic<br />
M/E signifies a pond that is on <strong>the</strong> border between mesotrophic and eutrophic conditions<br />
Note that <strong>the</strong> concentrations <strong>of</strong> chlorophyll and phosphorus used to delineate trophic state are not<br />
<strong>the</strong> same as <strong>the</strong> concentrations used to define ecoregional reference lake conditions. The<br />
ecoregional criteria are, as described in Section 5 (target concentrations), based on water quality<br />
conditions measured in eight pristine Cape Cod ponds.<br />
Based on this analysis, <strong>the</strong> <strong>Chatham</strong> <strong>Ponds</strong> may be grouped into categories describing current<br />
water quality and habitat conditions and use attainment. This grouping is presented in Table 8.<br />
Depth Categories:<br />
Shallow<br />
(less than 3 m<br />
maximum depth)<br />
Medium<br />
(3 – 8 m maximum depth)<br />
Deep<br />
(greater than 8 m<br />
maximum depth)<br />
Table 8<br />
Summary <strong>of</strong> Current Water Quality Conditions and Use Attainment<br />
Water Quality and Aquatic Habitat Status, 2000 – 2002 Conditions<br />
Meets Desired Uses Meets Desired Uses, Do Not Meet Desired<br />
with Evidence <strong>of</strong><br />
Uses<br />
Degradation<br />
Pickerel Pond<br />
Ryder Pond<br />
Trout Pond<br />
Blue Pond<br />
Mary’s Pond<br />
Minister’s Pond<br />
Goose Pond<br />
Schoolhouse Pond<br />
Barclay’s Pond<br />
Mill Pond<br />
Fox Pond<br />
White Pond<br />
Perch (Newty) Pond<br />
Black Pond-west<br />
Cranberry *<br />
Emery Pond<br />
Black Pond-mid<br />
Black Pond-east<br />
Stillwater Pond<br />
Lover’s Lake<br />
* Cranberry (flooded bog) assessment was based on visual assessment from a single site visit.<br />
EcoLogic LLC and 13<br />
November 20, 2003 Rev. 3<br />
Stearns & Wheler LLC
7. Summary <strong>of</strong> Findings<br />
Finding: Water quality conditions <strong>of</strong> <strong>the</strong> <strong>Chatham</strong> <strong>Ponds</strong> vary primarily as a function <strong>of</strong> depth.<br />
‣ Shallow ponds tend to be most naturally productive, with emergent vegetation and<br />
macroalgae along <strong>the</strong> shoreline. Phytoplankton cells are abundant, limiting visibility and<br />
imparting a green tinge to <strong>the</strong> water.<br />
‣ Deeper ponds are generally less productive, with lower concentrations <strong>of</strong> total<br />
phosphorus and chlorophyll -a and clearer water.<br />
‣ <strong>Ponds</strong> deeper than 4-5 m exhibit seasonal anoxia (dissolved oxygen concentrations less<br />
than 1 mg/l in <strong>the</strong> lower waters) or hypoxia (dissolved oxygen concentrations less than 4<br />
mg/l in <strong>the</strong> lower waters).<br />
‣ Phosphorus enrichment <strong>of</strong> <strong>the</strong> lower waters is evident in many <strong>of</strong> <strong>the</strong> deeper ponds; <strong>the</strong><br />
chance <strong>of</strong> this pool <strong>of</strong> nutrient mixing into <strong>the</strong> upper, sunlit waters and supporting algal<br />
growth during summer depends on <strong>the</strong> pond’s depth and surface area.<br />
‣ Phosphorus released to <strong>the</strong> lower waters is distributed throughout <strong>the</strong> water column<br />
during fall mixing. Because most <strong>of</strong> <strong>the</strong> kettle ponds lack defined outlets, much <strong>of</strong> this<br />
pool <strong>of</strong> phosphorus remains in <strong>the</strong> ponds and is available to support algal growth in <strong>the</strong><br />
spring when light and temperature conditions are favorable.<br />
Finding: The <strong>Chatham</strong> <strong>Ponds</strong> are in various stages <strong>of</strong> eutrophication; many are considered<br />
“impacted waters” based on regional criteria developed from limited measurements <strong>of</strong> water<br />
quality conditions in eight pristine Cape Cod ponds. However, designated uses are generally met.<br />
‣ Summer chlorophyll-a concentration exceed thresholds <strong>for</strong> pristine waters (reference lake<br />
conditions), as defined by ecoregional data sets. This finding has been interpreted by <strong>the</strong><br />
Cape Cod Commission to indicate that human activities have affected water quality<br />
and/or habitat conditions.<br />
‣ The ponds are used <strong>for</strong> swimming, boating, recreational fishing and aes<strong>the</strong>tic enjoyment.<br />
While a few ponds exhibit visual degradation <strong>of</strong> water quality conditions, most are<br />
aes<strong>the</strong>tic assets and provide tremendous habitat <strong>for</strong> a diverse assemblage <strong>of</strong> aquatic biota.<br />
‣ Monitoring <strong>for</strong> microbiological purity (using indicators <strong>of</strong> <strong>the</strong> potential presence <strong>of</strong><br />
disease-causing organisms) indicates that <strong>the</strong> pond waters are safe <strong>for</strong> swimming.<br />
Finding: Phosphorus is <strong>the</strong> limiting nutrient <strong>for</strong> primary production in <strong>the</strong> <strong>Chatham</strong> <strong>Ponds</strong>.<br />
‣ Unlike <strong>the</strong> coastal embayments, phosphorus ra<strong>the</strong>r than nitrogen limits <strong>the</strong> production <strong>of</strong><br />
algae and macrophytes in <strong>the</strong> inland ponds.<br />
‣ The ratio <strong>of</strong> nitrogen to phosphorus is likely to influence <strong>the</strong> species composition <strong>of</strong> <strong>the</strong><br />
algal community, particularly <strong>the</strong> importance <strong>of</strong> blue-green algae.<br />
‣ The nitrogen: phosphorus ratio <strong>of</strong> <strong>the</strong> ponds is very high (ranging from 13 to 144). In<br />
general, higher values are associated with more oligotrophic conditions. The<br />
nitrogen/phosphorus ratio, on average, decreases from more than 100 on <strong>the</strong> oligotrophic<br />
side to less than 10 on <strong>the</strong> eutrophic side. This can be interpreted as a tendency <strong>for</strong> lakes<br />
to shift from phosphorus dependency to nitrogen dependency with increasing trophy<br />
(Janus and Vollenweider 1981). Generally, lakes are considered to be phosphorus limited<br />
when <strong>the</strong> N:P ratio is greater than 15, and nitrogen limited when <strong>the</strong> N:P ratio falls to 7 or<br />
below. N:P ratios measured during 2001 and 2002 are summarized in Table 9.<br />
EcoLogic LLC and 14<br />
November 20, 2003 Rev. 3<br />
Stearns & Wheler LLC
Table 9<br />
Nitrogen:Phosphorus Ratios, <strong>Chatham</strong> Freshwater <strong>Ponds</strong><br />
Pond N:P Ratio , 2001 Data N:P Ratio , 2002 Data<br />
Barclay Pond 51 65<br />
Black Pond 42 44<br />
Black Pond 33 52<br />
Black Pond-Middle 64 70<br />
Blue Pond 13 49<br />
Emery Pond 63 44<br />
Goose Pond 17 27<br />
Lovers Lake 59 117<br />
Marys Pond 53 35<br />
Mill Pond 19 34<br />
Perch Pond 26 54<br />
Pickerel Pond 56 33<br />
Ryders Pond 61 59<br />
Schoolhouse Pond 17 15<br />
Stillwater Pond 35 58<br />
Trout Pond 17 25<br />
White Pond 35 144<br />
Finding: Phosphorus enters <strong>the</strong> <strong>Chatham</strong> <strong>Ponds</strong> from several sources; few (if any) <strong>of</strong> <strong>the</strong>se<br />
sources are easily controlled.<br />
‣ External sources <strong>of</strong> phosphorus include:<br />
o groundwater influx (natural background)<br />
o groundwater influenced by wastewater disposal (sewage plumes),<br />
o run<strong>of</strong>f from surfaces such as roadways<br />
o atmospheric deposition,<br />
o shoreline erosion,<br />
o swimmers,<br />
o wildlife (gulls, waterfowl, deer etc).<br />
‣ Internal sources <strong>of</strong> phosphorus include:<br />
o Release from pond bottom sediments during anoxic conditions<br />
Finding: Options <strong>for</strong> improving water quality and aquatic habitat conditions in <strong>the</strong> ponds are<br />
based on controlling inputs or altering <strong>the</strong> internal cycling <strong>of</strong> nutrients.<br />
‣ Some inputs cannot be controlled by local action alone: atmospheric deposition, natural<br />
background phosphorus in groundwater, wildlife.<br />
‣ Some inputs may be controlled using regulatory, structural, and/or educational means:<br />
o sewage plumes,<br />
o surface run<strong>of</strong>f,<br />
o shoreline erosion,<br />
o swimmers.<br />
‣ Techniques to control internal phosphorus cycling:<br />
o Alum application to seal bottom sediments and prevent phosphorus release<br />
o Use aerators or mixers to keep water column oxygenated and accelerate <strong>the</strong> rate <strong>of</strong><br />
decomposition <strong>of</strong> organic material<br />
o Drawdown ponds with outlet control structures<br />
• Winter drawdown to reduce macrophyte biomass<br />
EcoLogic LLC and 15<br />
November 20, 2003 Rev. 3<br />
Stearns & Wheler LLC
• Permanent drawdown to accelerate transition <strong>of</strong> hypereutrophic pond to wet<br />
meadow<br />
o Selective dredging to deepen ponds, remove organic material, improve recreational<br />
‣ Techniques to mitigate symptoms <strong>of</strong> eutrophication<br />
o Algaecide (e.g. copper sulfate)<br />
o O<strong>the</strong>r herbicides<br />
o Biomanipulation<br />
o Weed harvesting<br />
o Benthic barriers<br />
8. Recommendations<br />
8.1. Public Education<br />
‣ Forum to discuss pond ecology, range <strong>of</strong> conditions in <strong>Town</strong> ponds, and effective<br />
measure <strong>for</strong> improving water quality conditions.<br />
‣ Education regarding <strong>the</strong> importance <strong>of</strong> remaining on trails and protecting riparian<br />
(shoreline) areas<br />
‣ Education regarding application <strong>of</strong> fertilizers and pesticides<br />
8.2. Land acquisition<br />
‣ <strong>Town</strong> and Conservation Foundation to continue to pursue and acquire open space,<br />
incorporate resource-based priorities into decisions. Place high priority <strong>for</strong> acquisition <strong>of</strong><br />
properties in riparian areas.<br />
8.3. Bioengineering<br />
‣ Revegetation <strong>of</strong> shoreline areas<br />
‣ Trails through public lands planned, installed and maintained to reduce potential <strong>for</strong><br />
erosion<br />
8.4. Structural<br />
‣ Wastewater collection<br />
‣ Modification <strong>of</strong> systems <strong>for</strong> alum dosing<br />
‣ Stormwater basins with water quality controls: operations and maintenance are critical.<br />
‣ Pond level management (drawdown): Cranberry (flooded bog)<br />
‣ Public toilet facilities <strong>for</strong> beach areas<br />
‣ Improved stormwater management on parking lots adjacent to ponds<br />
8.5. Inspection and Monitoring<br />
‣ Inspection and maintenance <strong>of</strong> onsite systems<br />
‣ Continued participation in PALS<br />
‣ Modifications to monitoring program (Appendix C)<br />
EcoLogic LLC and 16<br />
November 20, 2003 Rev. 3<br />
Stearns & Wheler LLC
8.6. In-lake Measures<br />
‣ Alum treatment to seal bottom sediments:<br />
‣ Mixing<br />
‣ Benthic barriers<br />
‣ Mechanical or hand removal <strong>of</strong> weeds<br />
Many <strong>of</strong> <strong>the</strong> recommendations apply to all <strong>the</strong> ponds and <strong>the</strong>ir surrounding watersheds. Specific<br />
observations and recommendations <strong>for</strong> <strong>the</strong> 20 ponds are summarized in Table 10.<br />
Table 10<br />
Summary <strong>of</strong> Major Findings and Recommendations <strong>for</strong> <strong>Chatham</strong> <strong>Ponds</strong><br />
Pond Findings Recommended <strong>Action</strong>s<br />
Undisturbed shoreline. Nutrient flow in from Education, protection<br />
Black Pond-mid Emery<br />
Black Pond-west Algal blooms, macroalgae Benthic barriers <strong>for</strong> recreation<br />
Black Pond-east<br />
Clear water, tannins. Some potential run<strong>of</strong>f<br />
from golf course.<br />
Review fertilizer practices with golf<br />
course, to reduce potential loss to<br />
pond.<br />
Blue Pond High quality habitat, protected shoreline Continued protection<br />
Emery Pond<br />
Algal blooms (wind-blown mats), emergents.<br />
Tannins in water<br />
Flow in from cranberry bog likely nutrient<br />
source<br />
Public education re protecting<br />
shoreline vegetation, controls during<br />
construction. Hand pulling weeds,<br />
benthic barriers<br />
Barclay Pond Protected, high quality habitat Continued protection<br />
Goose Pond Pristine appearance, clear water. High priority <strong>for</strong> protection<br />
Lovers Lake<br />
Visible macroalgae, algal blooms<br />
Nutrient inactivation<br />
Shoreline protection<br />
Protected by land ownership<br />
Very shallow, Lilies 60% cover, protected<br />
watershed. Abandoned cranberry bogs. No<br />
Mill Pond<br />
swimming areas<br />
Mary's Pond Protected, high quality habitat Continued protection<br />
No access. Filling in to wetland<br />
Could provide public education<br />
Perch Pond<br />
regarding natural succession<br />
Pickerel Pond Lots <strong>of</strong> macroalgae Stormwater management<br />
Ryder’s Pond Tannins. High quality aquatic habitat Protection<br />
Official beach.<br />
Stormwater management in parking<br />
Schoolhouse<br />
areas<br />
Stillwater Pond Visible macroalgae, algal blooms Nutrient inactivation<br />
Algal bloom. Development, but little Stormwater management<br />
Trout Pond<br />
encroachment to shoreline<br />
Septic inspection and maintenance<br />
White Pond<br />
Priority <strong>for</strong> protection.<br />
Fox Pond<br />
(not monitored)<br />
Cranberry Pond<br />
(not monitored)<br />
Minister’s Pond<br />
(not monitored)<br />
High quality pond, clear water. Potential<br />
beach site. Some gulls, occasional elevated<br />
bacteria levels<br />
Emergents. Neighbors requested permission<br />
to apply herbicides. Formerly used aerator<br />
Advanced eutrophication, aes<strong>the</strong>tically<br />
unappealing<br />
Small kettle lake, protected. Tannins, some<br />
macroalgae<br />
Hand pulling emergents to improve<br />
access. Investigate use <strong>of</strong> solar or<br />
wind powered aerator<br />
Drawdown to accelerate transition to<br />
wetland<br />
Education, protection<br />
EcoLogic LLC and 17<br />
November 20, 2003 Rev. 3<br />
Stearns & Wheler LLC
9. Priority <strong>Action</strong>s <strong>for</strong> <strong>the</strong> <strong>Town</strong> <strong>of</strong> <strong>Chatham</strong><br />
<strong>Action</strong>s recommended <strong>for</strong> 2003 – 2004<br />
Convene a public educational <strong>for</strong>um to discuss current water quality and habitat conditions <strong>of</strong> <strong>the</strong><br />
ponds <strong>of</strong> <strong>Chatham</strong>. Solicit public input on <strong>the</strong> desired future <strong>for</strong> <strong>the</strong> ponds (overall and <strong>for</strong><br />
individual ponds). Major topics include:<br />
‣ The eutrophication process<br />
‣ The unique nature <strong>of</strong> <strong>the</strong> kettle ponds in nutrient cycling<br />
‣ How have conditions changed in recent decades<br />
‣ What can be done<br />
‣ Why each pond requires different strategy (no action, protection, active intervention)<br />
based on physical characteristics, current conditions, and desired use<br />
‣ What are <strong>the</strong> costs and benefits associated with alternatives<br />
‣ How will overall wastewater and facilities decisions affect <strong>the</strong> ponds<br />
Continue and expand <strong>the</strong> annual pond monitoring program to improve baseline data and ga<strong>the</strong>r<br />
data needed to apply <strong>for</strong> permits and funding <strong>for</strong> implementation <strong>of</strong> control measures. The<br />
recommended monitoring plan is included as Appendix C. Prepare an annual <strong>Chatham</strong> Pond<br />
Report Card to enhance public understanding <strong>of</strong> water quality conditions and contributing factors.<br />
Estimate <strong>the</strong> potential build-out <strong>of</strong> pond watersheds (once delineations are complete). Use this<br />
analysis to refine <strong>the</strong> listing <strong>of</strong> ponds to be considered <strong>for</strong> wastewater collection and out-<strong>of</strong> basin<br />
disposal. Based on existing conditions, priority areas include <strong>the</strong> watersheds <strong>of</strong> Stillwater Pond,<br />
Lovers Lake, Emery Pond and White Pond (see Appendices A and B <strong>for</strong> specific<br />
recommendations)<br />
Propose a local law requiring periodic inspection and pump out <strong>of</strong> individual on-site wastewater<br />
treatment systems. The frequency can be linked to distance to ponds, with more stringent<br />
requirements within a defined buffer zone.<br />
Confer with engineering consultants, public health agencies, and MADEP to determine feasibility<br />
<strong>of</strong> requiring alum dosing to on-site wastewater disposal systems.<br />
Review local erosion and sedimentation control laws and determine if <strong>the</strong>y could be improved to<br />
prevent sediment loss to <strong>the</strong> ponds. If warranted, propose revisions <strong>for</strong> approval.<br />
Convene technical committee (or select consultant) to initiate detailed planning and cost<br />
estimating, identify funding sources, secure non-local funding as available, and acquire permits<br />
<strong>for</strong> alum application to Stillwater Pond and/or Lovers Lake. With funding and permits, treat<br />
ponds in summer 2005.<br />
EcoLogic LLC and 18<br />
November 20, 2003 Rev. 3<br />
Stearns & Wheler LLC
10. References<br />
Cape Cod Commission Water Resources Office. May 2003. Cape Cod Pond and Lake Atlas. 53<br />
pp + App.<br />
Cogger, C.G., L.M. Hajjar, C.L. Moe, & M.D. Sobsey. 1988. Septic system per<strong>for</strong>mance on a<br />
coastal barrier island. J. Environ. Qual. 17(3):401-408.<br />
Cooke, G. D., E. B. Welch, S.A. Peterson and P.R. Newroth. 1993. Restoration and Management<br />
<strong>of</strong> Lakes and Reservoirs. 2 nd Ed. Lewis Publ. Boca Raton FL.<br />
Holdren, C. W. Jones and J. Taggart. 2001. Managing lakes and reservoirs. N. Am. Lake<br />
Manage. Soc. and Terrene Inst., in coop. with Off. Water Assess. Watershed Prot. Div. U.S.<br />
Environ. Prot. Agency, Madison WI.<br />
Horsley & Witten, Inc. Feb. 2003. A qualitative survey <strong>of</strong> pond shoreline vegetation and<br />
anthropogenic threats at eleven freshwater ponds in <strong>the</strong> Pleasant Bay Area <strong>of</strong> Critical<br />
Environmental Concern. Report prepared <strong>for</strong> Pleasant Bay Resource Management Alliance,<br />
Harwich MA. 17 pp + App.<br />
Hutchinson., G. E. 1957. A Treatise on Limnology. Volume I: Geography, Physics and<br />
Chemistry. John Wiley and Sons NY.<br />
Janus, L.L. and R.A. Vollenweider. 1981. The OECD Cooperative program on eutrophication.<br />
Canadian contribution summary report. Scientific Series No. 131. CCIW. Burlington Ont.<br />
Massachusetts Department <strong>of</strong> Environmental Protection 2003 The Massachusetts Estuaries<br />
Project Embayment Restoration and Guidance <strong>for</strong> Implementation Strategies. MADEP, Boston<br />
MA.<br />
McCobb, T.D., Leblanc, D.R., Walter, D.A., Hess, K.M., Kent, D.B., Smith, R.L., 2003,<br />
Phosphorus in a ground-water contaminant plume discharging to Ashumet Pond, Cape Cod,<br />
Massachusetts, 1999, U.S. Geological Survey Water-Resources Investigations Report 02-4306,<br />
69 p.<br />
Osgood, R. A. 1988. Lake mixis and internal phosphorus dynamics. Arch. Hydrobiol.<br />
113(4):629-638.<br />
Portnoy, J.W. 1990. Gull contributions <strong>of</strong> phosphorus and nitrogen to a Cape Cod kettle pond.<br />
Hydrobiologia. 202:61-69.<br />
Portnoy, J.W., Winkler, M.G., San<strong>for</strong>d, P.R. & C.N. Farris. 2001. Kettle Pond Data Atlas:<br />
Paleoecology and Modern Water Chemistry. Cape Cod National Seashore, National Park Service,<br />
U.S. Department <strong>of</strong> Interior. 119 pp.<br />
Shoumans, O.F. and A. Breeuwsma 1997. The relations between accumulation and leaching <strong>of</strong><br />
phosphorus: laboratory, field and modeling results. p.361 – 363 in H. Tunney et al {Ed}<br />
Phosphorus Loss From Soil to Water. CAB International. NY.<br />
EcoLogic LLC and 19<br />
November 20, 2003 Rev. 3<br />
Stearns & Wheler LLC
Appendix A. Summary <strong>of</strong> Regulatory Setbacks and Recommendations <strong>for</strong> Septic Systems in<br />
Coastal Areas<br />
• Buzzards Bay Watershed Management <strong>Plan</strong><br />
o Recommends 250 ft setback from surface waters and wetlands, (viral pollution)<br />
o Where this setback cannot be met, changes in system design and application rate are<br />
required to ensure removal <strong>of</strong> viruses.<br />
• New Hampshire’s Shoreland Protection Act [3.10 Leach Field And Septic Tank Setback<br />
(Added 1990, Amended 1992)]<br />
o “Where <strong>the</strong> naturally occurring receiving soil down-gradient <strong>of</strong> <strong>the</strong> leaching portions<br />
<strong>of</strong> a septic system is a porous sand and gravel material with a percolation rate faster<br />
than two (2) minutes per inch, <strong>the</strong> setback shall be at least 125 feet.<br />
o For naturally occurring receiving soils with restrictive layers within 18 inches <strong>of</strong> <strong>the</strong><br />
o<br />
surface, <strong>the</strong> setback shall be at least 100 feet; and<br />
For naturally occurring receiving soils with any o<strong>the</strong>r characteristics <strong>the</strong> setback shall<br />
be at least 75 feet..”<br />
• CAMA Handbook For Development In Coastal North Carolina: Section 3<br />
o Septic tanks and drainfields must be located at least 100 feet from waters classified as<br />
WS IV by <strong>the</strong> Environmental Management Commission.<br />
o<br />
No sewers, septic tank fields or o<strong>the</strong>r sources <strong>of</strong> pollution may be built within 500 feet<br />
<strong>of</strong> <strong>the</strong> edge <strong>of</strong> <strong>the</strong> Fresh Pond in <strong>the</strong> Nags Head/Kill Devil Hills Fresh Pond<br />
watershed. Between 500 feet and 1,200 feet from <strong>the</strong> pond, septic systems are limited<br />
to one system serving a single-family home with no more than four bedrooms (or an<br />
equivalent volume <strong>of</strong> sewage) on a tract <strong>of</strong> land at least 40,000 square feet in size.<br />
• Rhode Island towns:<br />
o Burrillville: 200 ft from wetlands<br />
o<br />
o<br />
o<br />
o<br />
o<br />
o<br />
o<br />
o<br />
o<br />
o<br />
Charlestown:<br />
• 100 feet from a freshwater or coastal wetland.<br />
• 200 feet from a ten-foot-wide flowing body <strong>of</strong> water.<br />
• 100 feet from flowing bodies <strong>of</strong> water less than 10 feet wide.<br />
• 100 feet from intermittent streams.<br />
• 100 feet from floodplains.<br />
Foster: 200 ft from any pond, stream, spring or brook<br />
Glocester: 150 ft from ponds, streams or springs<br />
Jamestown: 150 ft from any freshwater<br />
Narrangasett: Special use permits <strong>for</strong> septic systems within 150 ft. <strong>of</strong> coastal and<br />
freshwater wetlands.<br />
New Shoreham:<br />
• 150 feet <strong>of</strong> vegetated buffer shall be maintained from any septic system to a<br />
freshwater wetland or coastal feature.<br />
• 200 feet <strong>of</strong> vegetated buffer shall be maintained from any septic system to Sands<br />
Pond, Peckham Pond and Fresh Pond.<br />
Scituate: 150 ft from surface waters<br />
South Kingstown requires special use permits <strong>for</strong> all septic systems located:<br />
• Within 50 feet <strong>of</strong> a bog, marsh, swamp or pond.<br />
• Within 200 feet <strong>of</strong> flowing bodies <strong>of</strong> water 10 feet or more in width.<br />
• Within 100 feet <strong>of</strong> flowing bodies <strong>of</strong> water less than10 feet in width.<br />
• Within 150 feet <strong>of</strong> floodplains.<br />
• Within 150 feet <strong>of</strong> o<strong>the</strong>r freshwater wetlands<br />
Warren: 150 ft from any body <strong>of</strong> water, including wetlands<br />
West Greenwich: 200 ft from edge <strong>of</strong> any pond or stream<br />
EcoLogic LLC and 20<br />
November 20, 2003 Rev. 3<br />
Stearns & Wheler LLC
Appendix B. Summary <strong>of</strong> Pond Management Alternatives<br />
Category 1: Control Inputs<br />
Method<br />
How does it Work?<br />
Potential Benefits<br />
Potential Drawbacks<br />
Data gaps to make<br />
decision<br />
Costs (Relative)<br />
Permitting issues<br />
1 2 3<br />
Reduce phosphorus Reduce phosphorus from Reduce phosphorus from<br />
from on-site wastewater on-site wastewater on-site wastewater disposal<br />
disposal systems by disposal systems by systems by requiring<br />
centralized collection modifications to require frequent inspections and<br />
and disposal outside <strong>of</strong> alum additions to septic maintenance <strong>of</strong> systems<br />
watershed zone <strong>of</strong> tanks<br />
influence<br />
Collection system and Physical modification to Modification to local laws<br />
treatment/disposal<br />
Decreased loading <strong>of</strong> all<br />
wastewater<br />
contaminants, including<br />
pathogens<br />
Could increase<br />
development pressure<br />
Integrated with rest <strong>of</strong><br />
wastewater decisions.<br />
Existing data do not<br />
define extent <strong>of</strong> problem<br />
High (likely to receive<br />
some public funds)<br />
Collection system will<br />
have environmental<br />
impact. Need to identify<br />
acceptable site <strong>for</strong><br />
disposal to groundwater.<br />
Conservation<br />
Commission approval<br />
needed.<br />
wastewater systems<br />
Decreased loading <strong>of</strong><br />
phosphorus<br />
More complex systems,<br />
more maintenance. More<br />
sludge<br />
Existing data do not<br />
define extent <strong>of</strong> problem<br />
Moderate (may receive<br />
public funds <strong>for</strong><br />
demonstration)<br />
Dept. <strong>of</strong> Heath approvals,<br />
sludge disposal<br />
Conservation<br />
Commission approval<br />
needed.<br />
Decreased loading <strong>of</strong> all<br />
wastewater contaminants,<br />
including pathogens<br />
Public acceptance needs to<br />
be very high<br />
Existing data do not define<br />
extent <strong>of</strong> problem<br />
Low (borne by<br />
homeowners)<br />
Longevity High Moderate Moderate<br />
<strong>Ponds</strong> that might be<br />
appropriate <strong>for</strong> this<br />
alternative<br />
all<br />
Highest number <strong>of</strong> onsite<br />
systems are in<br />
Lovers, White,<br />
Stillwater, Emery<br />
Impaired ponds with >20<br />
residences: Emery,<br />
Stillwater, Lovers.<br />
Non-impaired ponds, at<br />
least 15 residences:<br />
White, Schoolhouse.<br />
Consider Trout and<br />
Pickerel, based on water<br />
quality<br />
Dept. <strong>of</strong> Health approvals<br />
Conservation Commission<br />
approval needed.<br />
EcoLogic LLC and 21<br />
November 20, 2003 Rev. 3<br />
Stearns & Wheler LLC
Category 1 (continued): Control Inputs<br />
Method<br />
How does it Work?<br />
4 5 6<br />
Water quality inlets to Public education and<br />
stormwater infiltration outreach<br />
basins<br />
Stormwater collection<br />
and treatment prior to<br />
groundwater discharge<br />
Educate public on<br />
importance <strong>of</strong><br />
landscaping, erosion<br />
controls, beach sanitation<br />
Potential Benefits Reduced loading Reduced loading.<br />
Increase public awareness<br />
<strong>of</strong> ponds and <strong>the</strong>ir<br />
vulnerability<br />
Potential Drawbacks<br />
Data gaps to make<br />
decision<br />
Most systems designed<br />
to capture sediment.<br />
Higher maintenance<br />
No estimate <strong>of</strong> <strong>the</strong><br />
contribution <strong>of</strong> soluble<br />
P from stormwater<br />
None<br />
None<br />
Discourage gulls by using<br />
scare techniques<br />
Reduces nutrient deposition<br />
from birds<br />
Reduced loading <strong>of</strong><br />
nutrients and bacteria<br />
Disruptive<br />
Costs (Relative) Low Low Low<br />
Permitting issues Requires siting,<br />
Conservation<br />
Commission approval<br />
needed.<br />
None<br />
Longevity Moderate Moderate (prevention <strong>of</strong><br />
incremental source likely<br />
to be a small source)<br />
<strong>Ponds</strong> that might be<br />
appropriate <strong>for</strong> this<br />
alternative<br />
All, especially those<br />
with developed<br />
watersheds, Trout and<br />
Pickerel have evidence<br />
<strong>of</strong> sediment deposition<br />
from run<strong>of</strong>f<br />
All<br />
Estimate maximum number<br />
<strong>of</strong> gulls, use research<br />
reported in Portnoy (1990)<br />
Needs approvals from Fish<br />
and Wildlife, MADEP.<br />
Conservation Commission<br />
approval needed.<br />
Likely to be effective only<br />
while active measures are<br />
taken, although birds may<br />
move to o<strong>the</strong>r areas<br />
White<br />
EcoLogic LLC and 22<br />
November 20, 2003 Rev. 3<br />
Stearns & Wheler LLC
Category 2: Alter Internal Cycling <strong>of</strong> Nutrients<br />
1 2 3<br />
Method Alum application Sediment oxidation Circulation<br />
How does it Work? Alum hydrolyzes in water,<br />
<strong>for</strong>ming a floc. As <strong>the</strong> floc<br />
settles it removes particulate<br />
material as well as any<br />
dissolved P. If applied<br />
properly, <strong>for</strong>ms a barrier on<br />
sediment surface that will<br />
continue to trap P.<br />
Procedure injects<br />
calcium nitrate into<br />
top 10” sediment to<br />
break down organics<br />
and promote<br />
denitrification.<br />
Potential Benefits<br />
Potential Drawbacks<br />
Data gaps to make<br />
decision<br />
Costs (Relative)<br />
Permitting issues<br />
Longevity<br />
<strong>Ponds</strong> that might be<br />
appropriate <strong>for</strong> this<br />
alternative<br />
• Long history <strong>of</strong> use<br />
• Does not seem to affect<br />
o<strong>the</strong>r aquatic organisms<br />
• May create layer over<br />
sediments retarding future<br />
sediment P release<br />
• Long-term results<br />
• Readily available<br />
Low pH ponds, need<br />
buffering (sodium<br />
aluminate). Potential <strong>for</strong><br />
aluminum toxicity if pH<br />
declines. Loss <strong>of</strong> benthic<br />
organisms.<br />
Sediment testing to estimate<br />
optimal dose<br />
Can be high, application rate<br />
estimated at $70 per 40-<br />
lbs.(40 lbs. treats 1ac-ft) *<br />
Requires permit, testing <strong>for</strong><br />
optimal dose. MADEP<br />
cautious following Hamblin<br />
Pond fishkill. Conservation<br />
Commission approval<br />
needed.<br />
Moderate (at least several<br />
years)<br />
Deeper ponds with elevated<br />
TP in lower waters:<br />
Stillwater, Lovers.<br />
* Source <strong>for</strong> cost estimates: Holdren et al. 2001<br />
If successful will<br />
greatly reduce<br />
internal P loading<br />
from sediments<br />
Optimal pH <strong>of</strong><br />
sediments 7 – 7.5;<br />
would require liming.<br />
Considered an<br />
experimental<br />
technique.<br />
Sediment testing to<br />
calculate dose<br />
Can be high, $8,000 –<br />
$12,000 per acre *<br />
Requires permit,<br />
testing <strong>for</strong> optimal<br />
dose. Conservation<br />
Commission approval<br />
needed.<br />
Moderate (at least<br />
several years)<br />
Impaired ponds with<br />
DO depletion:<br />
Emery, Trout<br />
Prevents stratification from<br />
developing. Keeps more<br />
oxygen in water column<br />
and thus available to break<br />
down organic material.<br />
Reduces surface algal<br />
blooms, improved habitat<br />
<strong>for</strong> aquatic biota, may<br />
retard sediment P release<br />
Results likely to be subtle,<br />
requires energy source<br />
(electric, solar or wind).<br />
May increase algal<br />
production throughout<br />
water column.<br />
DO pr<strong>of</strong>iles over season,<br />
history<br />
Variable, depending on<br />
power source. Solarpowered<br />
mixing devices<br />
may cost $25,000<br />
Conservation Commission<br />
approval needed.<br />
Only effective when mixers<br />
working<br />
Fox<br />
EcoLogic LLC and 23<br />
November 20, 2003 Rev. 3<br />
Stearns & Wheler LLC
Category 2 (continued): Alter Internal Cycling <strong>of</strong> Nutrients<br />
4 5<br />
Method Dredging Drawdown<br />
How does it Work? Sediment is physically removed,<br />
also removing accumulated<br />
nutrients and organic material<br />
Potential Benefits<br />
Potential Drawbacks<br />
Data gaps to make<br />
decision<br />
Reduced internal nutrient supply,<br />
increases water depth, can reduce<br />
sediment oxygen demand<br />
Expensive if disposal site not<br />
nearby. Temporary turbidity,<br />
removes macroinvertebrates,<br />
temporarily interferes with<br />
recreation. Might reduce ponds’<br />
natural capacity <strong>for</strong> denitrification<br />
and thus allow more soluble<br />
nitrogen to make its way to coastal<br />
embayments.<br />
Quality <strong>of</strong> sediments (affects<br />
disposal options and costs), detailed<br />
bathymetry to estimate volumes and<br />
costs.<br />
Lowering water level will dry sediments and<br />
allow sediments to oxidize and compact.<br />
May alter nutrient availability. Opportunity<br />
<strong>for</strong> shoreline cleanup.<br />
Possible impacts on contiguous wetlands,<br />
may change habitat <strong>for</strong> amphibians. <strong>Ponds</strong><br />
with water level controls may be managed<br />
<strong>for</strong> herring. Temporary loss <strong>of</strong> waterfowl<br />
habitat. Potential to create highly<br />
unappealing aes<strong>the</strong>tic conditions <strong>for</strong><br />
neighbors.<br />
Water level control needed, <strong>the</strong>re<strong>for</strong>e not<br />
feasible <strong>for</strong> most ponds<br />
Costs (Relative) $15,000 - $50,000/acre *
Category 3: Mitigate <strong>the</strong> Symptoms <strong>of</strong> Eutrophication<br />
1 2 3<br />
Method<br />
Mechanical removal Hand pulling weeds Benthic barriers<br />
<strong>of</strong> weeds<br />
How does it Work? Removes rooted<br />
aquatic plants from<br />
targeted areas using<br />
various mechanical<br />
Removes rooted<br />
aquatic plants from<br />
targeted areas<br />
Mat <strong>of</strong> variable composition<br />
laid on bottom <strong>of</strong> target areas,<br />
used in swimming areas or<br />
around docks<br />
means<br />
Potential Benefits Highly flexible Highly flexible Prevents plant growth, reduces<br />
Potential Drawbacks<br />
Data gaps to make<br />
decision<br />
Costs (Relative)<br />
Permitting issues<br />
Longevity<br />
<strong>Ponds</strong> that might be<br />
appropriate <strong>for</strong> this<br />
alternative<br />
Creates turbidity, may<br />
spread some plants by<br />
fragmentation<br />
Useful <strong>for</strong> areas where<br />
recreational access is<br />
limited by weeds<br />
Hydroraking or<br />
rotavation<br />
$2000/acre*<br />
Turbidity, avoidance<br />
<strong>of</strong> critical habitat<br />
areas and<br />
spawning/early life<br />
stages <strong>of</strong> fish<br />
community<br />
Conservation<br />
Commission approval<br />
needed.<br />
Usually needs to be<br />
repeated once or twice<br />
a year<br />
Trout, Pickerel,<br />
Emery, Stillwater<br />
(cove areas); Fox<br />
* Source <strong>for</strong> cost estimates: Holdren et al. 2001<br />
Labor intensive<br />
Useful <strong>for</strong> areas where<br />
recreational access is<br />
limited by weeds<br />
$100/acre*<br />
Minimal<br />
Conservation<br />
Commission approval<br />
needed.<br />
Usually needs to be<br />
repeated once or twice<br />
a year<br />
Areas where<br />
homeowners access<br />
diminishing (e.g.<br />
Ministers, Emery, Fox,<br />
Stillwater, Lovers,<br />
Trout, Pickerel)<br />
turbidity from s<strong>of</strong>t sediments<br />
Require maintenance<br />
Useful <strong>for</strong> areas where<br />
recreational access is limited by<br />
weeds<br />
$20,000 /acre (only small areas<br />
typically treated)*<br />
Minimal, need to avoid critical<br />
habitat Conservation<br />
Commission approval needed.<br />
Need to be replaced every 1 – 2<br />
years<br />
Areas where homeowner access<br />
diminishing (e.g. Ministers,<br />
Emery, Fox, Stillwater, Lovers,<br />
Trout, Pickerel)<br />
EcoLogic LLC and 25<br />
November 20, 2003 Rev. 3<br />
Stearns & Wheler LLC
Category 3 (continued): Mitigate <strong>the</strong> Symptoms <strong>of</strong> Eutrophication<br />
Method<br />
How does it Work?<br />
Potential Benefits<br />
Potential Drawbacks<br />
Data gaps to make<br />
decision<br />
Costs (Relative)<br />
Permitting issues<br />
Longevity<br />
<strong>Ponds</strong> that might be<br />
appropriate <strong>for</strong> this<br />
alternative<br />
1 2 3<br />
Chemical control <strong>of</strong> Chemical control <strong>of</strong><br />
algae (several copperbased<br />
macrophytes<br />
and organic<br />
compounds approved<br />
<strong>for</strong> this use)<br />
Algaecides: kill algae<br />
by direct toxicity or<br />
by metabolic<br />
interference<br />
Rapidly eliminates<br />
algae from water<br />
column<br />
May be toxic to nontarget<br />
organisms,<br />
nutrients from<br />
decaying algae may<br />
recycle, oxygen<br />
demand created to<br />
decompose killed<br />
cells, may restrict<br />
water uses<br />
Water pH, alkalinity,<br />
background<br />
concentrations <strong>of</strong><br />
metals; sediment<br />
quality (AVS and<br />
TOC)<br />
Depends on<br />
compound, Chelated<br />
copper compounds<br />
range $150 – 300/acre<br />
per application*<br />
Requires permit and<br />
approvals from<br />
environmental and<br />
public health<br />
agencies, including<br />
Conservation<br />
Commission.<br />
Short-term (weeks to<br />
months)<br />
* Source <strong>for</strong> cost estimates: Holdren et al. 2001<br />
Various modes <strong>of</strong><br />
uptake to plant and<br />
biochemical pathways<br />
disrupted, ultimately<br />
results in plant<br />
senescence and death<br />
Reduces density <strong>of</strong><br />
macrophytes in treated<br />
areas<br />
May be toxic to nontarget<br />
organisms,<br />
nutrients from decaying<br />
plants may recycle,<br />
oxygen demand<br />
created, may restrict<br />
water uses<br />
Detailed species<br />
inventories needed to<br />
select most appropriate<br />
chemicals<br />
Depends on compound.<br />
Range per acre: $200<br />
(Diquat) to $1000<br />
(Fluoridone, three<br />
applications)*<br />
Requires permit and<br />
approvals from<br />
environmental and<br />
public health agencies,<br />
including. Conservation<br />
Commission<br />
Annual<br />
Mechanical harvesting <strong>of</strong><br />
macrophytes<br />
<strong>Plan</strong>ts cut in place, depth <strong>of</strong> 2 –<br />
10 ft roots not harvested.<br />
Cuttings collected and removed<br />
from pond<br />
Improved recreational access<br />
Non selective in harvested area,<br />
may disrupt habitat, may<br />
remove native insects that help<br />
control plants<br />
Species abundance, access<br />
points <strong>for</strong> equipment, disposal<br />
sites<br />
For moderately dense,<br />
submersed vegetation: assume<br />
$200 – 600/acre*<br />
Minor, need to develop plan <strong>for</strong><br />
harvesting and upland disposal<br />
sites. Conservation Commission<br />
approval needed.<br />
Short-term (weeks)<br />
None recommended None recommended None recommended<br />
EcoLogic LLC and 26<br />
November 20, 2003 Rev. 3<br />
Stearns & Wheler LLC
Appendix C. Recommended Water Quality Monitoring Program<br />
The existing water quality monitoring program provides an excellent foundation <strong>for</strong> tracking<br />
baseline water quality conditions. We recommend certain modifications, as outlined below.<br />
Program<br />
element<br />
Parameters<br />
measured<br />
<strong>Ponds</strong><br />
monitored<br />
by <strong>Town</strong><br />
Current Program Recommended Program Rationale<br />
Secchi disk<br />
transparency, total P,<br />
total N, chlorophyll-a,<br />
phaeophytin, total<br />
alkalinity, field<br />
parameters (pr<strong>of</strong>ile DO,<br />
pH, temperature at<br />
deepest point); Bacteria<br />
sampling at public<br />
beaches to assess<br />
suitability <strong>for</strong> water<br />
contact recreation.<br />
17 ponds Add Fox<br />
Delete Perch<br />
Same, consider if <strong>the</strong>re is a<br />
cost savings associated with<br />
dropping total N (although<br />
data consistency may be<br />
important to SMAST<br />
program)<br />
Data indicate that ponds<br />
are P limited (N:P ratio<br />
is high)<br />
(Fox) Provide guidance<br />
to homeowners<br />
regarding potential<br />
benefits <strong>of</strong> mixing.<br />
(Perch) Problematic<br />
access, natural<br />
progression to wetland<br />
well underway<br />
Frequency Variable At least monthly (May –<br />
October) <strong>for</strong> all ponds.<br />
Biweekly pr<strong>of</strong>ile and water<br />
quality sampling<br />
recommended <strong>for</strong> Stillwater<br />
and Lovers (to support<br />
alum assessment), and o<strong>the</strong>r<br />
deep ponds (Goose, White,<br />
Schoolhouse, Barclays).<br />
Matrix Water column Water column, add limited<br />
sediment testing in ponds<br />
considered <strong>for</strong> alum<br />
treatment to quantify labile<br />
phosphorus.<br />
Increased frequency will<br />
support more robust<br />
averages and better<br />
comparisons to<br />
ecoregional criteria.<br />
Need to evaluate<br />
sediment phosphorus<br />
flux<br />
EcoLogic LLC and 27<br />
November 20, 2003 Rev. 3<br />
Stearns & Wheler LLC