Action Plan for the Town of Chatham Ponds
rev 3a report.pdf - Town to Chatham
rev 3a report.pdf - Town to Chatham

Create successful ePaper yourself
Turn your PDF publications into a flip-book with our unique Google optimized e-Paper software.
Pond<br />
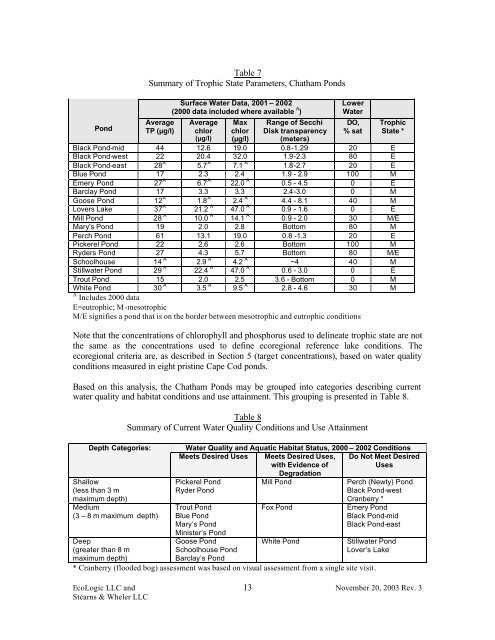
Table 7<br />
Summary <strong>of</strong> Trophic State Parameters, <strong>Chatham</strong> <strong>Ponds</strong><br />
Average<br />
TP (µg/l)<br />
Surface Water Data, 2001 – 2002<br />
(2000 data included where available A )<br />
Average<br />
chlor<br />
(µg/l)<br />
Max<br />
chlor<br />
(µg/l)<br />
Range <strong>of</strong> Secchi<br />
Disk transparency<br />
(meters)<br />
Lower<br />
Water<br />
DO,<br />
% sat<br />
Trophic<br />
State *<br />
Black Pond-mid 44 12.6 19.0 0.8-1.29 20 E<br />
Black Pond-west 22 20.4 32.0 1.9-2.3 80 E<br />
Black Pond-east 28 A 5.7 A 7.1 A 1.8-2.7 20 E<br />
Blue Pond 17 2.3 2.4 1.9 - 2.9 100 M<br />
Emery Pond 27 A 6.7 A 22.0 A 0.5 - 4.5 0 E<br />
Barclay Pond 17 3.3 3.3 2.4-3.0 0 M<br />
Goose Pond 12 A 1.8 A 2.4 A 4.4 - 8.1 40 M<br />
Lovers Lake 37 A 21.2 A 47.0 A 0.9 - 1.6 0 E<br />
Mill Pond 28 A 10.0 A 14.1 A 0.9 - 2.0 30 M/E<br />
Mary's Pond 19 2.0 2.8 Bottom 80 M<br />
Perch Pond 61 13.1 19.0 0.8 -1.3 20 E<br />
Pickerel Pond 22 2.6 2.6 Bottom 100 M<br />
Ryders Pond 27 4.3 5.7 Bottom 80 M/E<br />
Schoolhouse 14 A 2.9 A 4.2 A ~4 40 M<br />
Stillwater Pond 29 A 22.4 A 47.0 A 0.6 - 3.0 0 E<br />
Trout Pond 15 2.0 2.5 3.6 - Bottom 0 M<br />
White Pond 30 A 3.5 A 9.5 A 2.8 - 4.6 30 M<br />
A Includes 2000 data<br />
E=eutrophic; M-mesotrophic<br />
M/E signifies a pond that is on <strong>the</strong> border between mesotrophic and eutrophic conditions<br />
Note that <strong>the</strong> concentrations <strong>of</strong> chlorophyll and phosphorus used to delineate trophic state are not<br />
<strong>the</strong> same as <strong>the</strong> concentrations used to define ecoregional reference lake conditions. The<br />
ecoregional criteria are, as described in Section 5 (target concentrations), based on water quality<br />
conditions measured in eight pristine Cape Cod ponds.<br />
Based on this analysis, <strong>the</strong> <strong>Chatham</strong> <strong>Ponds</strong> may be grouped into categories describing current<br />
water quality and habitat conditions and use attainment. This grouping is presented in Table 8.<br />
Depth Categories:<br />
Shallow<br />
(less than 3 m<br />
maximum depth)<br />
Medium<br />
(3 – 8 m maximum depth)<br />
Deep<br />
(greater than 8 m<br />
maximum depth)<br />
Table 8<br />
Summary <strong>of</strong> Current Water Quality Conditions and Use Attainment<br />
Water Quality and Aquatic Habitat Status, 2000 – 2002 Conditions<br />
Meets Desired Uses Meets Desired Uses, Do Not Meet Desired<br />
with Evidence <strong>of</strong><br />
Uses<br />
Degradation<br />
Pickerel Pond<br />
Ryder Pond<br />
Trout Pond<br />
Blue Pond<br />
Mary’s Pond<br />
Minister’s Pond<br />
Goose Pond<br />
Schoolhouse Pond<br />
Barclay’s Pond<br />
Mill Pond<br />
Fox Pond<br />
White Pond<br />
Perch (Newty) Pond<br />
Black Pond-west<br />
Cranberry *<br />
Emery Pond<br />
Black Pond-mid<br />
Black Pond-east<br />
Stillwater Pond<br />
Lover’s Lake<br />
* Cranberry (flooded bog) assessment was based on visual assessment from a single site visit.<br />
EcoLogic LLC and 13<br />
November 20, 2003 Rev. 3<br />
Stearns & Wheler LLC