

Dementia
gi2hff
gi2hff
- No tags were found...

You also want an ePaper? Increase the reach of your titles
YUMPU automatically turns print PDFs into web optimized ePapers that Google loves.
GBD region<br />
Per<br />
capita<br />
costs<br />
(US$)<br />
Number of<br />
people with<br />
dementia<br />
Aggregated costs (billions US$)<br />
Informal care<br />
(all ADLs)<br />
Direct<br />
medical costs<br />
Direct Social<br />
costs<br />
Total<br />
costs<br />
Total<br />
costs as %<br />
of GDP<br />
Direct<br />
costs as %<br />
of GDP<br />
Australasia 32 370 311 327 4.30 0.70 5.07 10.08 0.97% 0.56%<br />
Asia Pacific High<br />
Income<br />
29 057 2 826 388 34.60 5.23 42.29 82.13 1.31% 0.76%<br />
Oceania 6 059 16 553 0.07 0.02 0.01 0.10 0.46% 0.12%<br />
Asia Central 2 862 330 125 0.43 0.28 0.24 0.94 0.36% 0.20%<br />
Asia East 4 078 5 494 387 15.24 4.33 2.84 22.41 0.40% 0.13%<br />
Asia South 903 4 475 324 2.31 1.16 0.57 4.04 0.25% 0.11%<br />
Asia Southeast 1 601 2 482 076 1.77 1.48 0.73 3.97 0.28% 0.15%<br />
Europe Western 30 122 6 975 540 87.05 30.19 92.88 210.12 1.29% 0.75%<br />
Europe Central 12 891 1 100 759 8.59 2.67 2.94 14.19 1.10% 0.44%<br />
Europe Eastern 7 667 1 869 242 7.96 3.42 2.94 14.33 0.90% 0.40%<br />
North America High<br />
Income<br />
48 605 4 383 057 78.76 36.83 97.45 213.04 1.30% 0.82%<br />
Caribbean 9 092 327 825 1.50 0.78 0.71 2.98 1.06% 0.53%<br />
Latin America Andean 3 663 254 925 0.35 0.31 0.28 0.93 0.43% 0.27%<br />
Latin America Central 5 536 1 185 559 1.58 2.61 2.37 6.56 0.37% 0.28%<br />
Latin America<br />
Southern<br />
Latin America<br />
Tropical<br />
North Africa / Middle<br />
East<br />
Sub-Saharan Africa<br />
Central<br />
Sub-Saharan Africa<br />
East<br />
Sub-Saharan Africa<br />
Southern<br />
Sub-Saharan Africa<br />
West<br />
8 243 614 523 2.36 1.42 1.29 5.07 1.02% 0.54%<br />
6 881 1 054 560 2.17 2.67 2.42 7.26 0.42% 0.29%<br />
3 296 1 145 633 1.90 2.05 0.54 4.50 0.16% 0.09%<br />
1 081 67 775 0.04 0.02 0.01 0.07 0.06% 0.02%<br />
1 122 360602 0.28 0.08 0.04 0.40 0.17% 0.05%<br />
6 834 100 733 0.52 0.11 0.06 0.69 0.24% 0.06%<br />
969 181 803 0.11 0.04 0.02 0.18 0.06% 0.02%<br />
World Bank classification<br />
Low income 868 5 036 979 2.52 1.23 0.62 4.37 0.24% 0.10%<br />
Lower middle income 3 109 9 395 204 18.90 6.74 3.57 29.21 0.35% 0.12%<br />
Upper middle income 6 827 4 759 025 13.70 10.44 8.35 32.49 0.50% 0.29%<br />
High income 32 865 16 367 508 216.77 78.00 243.14 537.91 1.24% 0.74%<br />
Total 16 986 35 558 717 251.89 96.41 255.69 603.99 1.01% 0.59%<br />
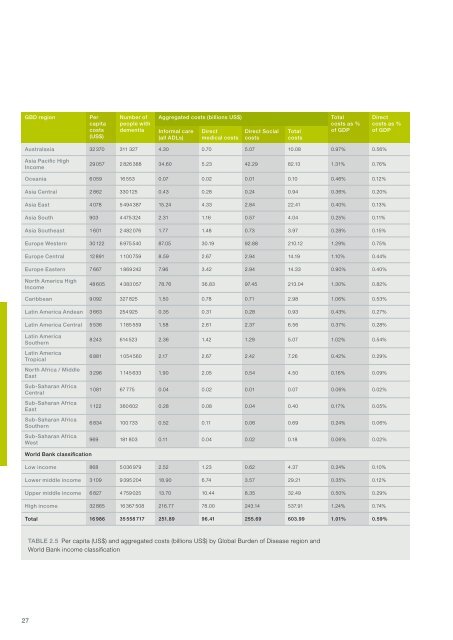
Table 2.5 Per capita (US$) and aggregated costs (billions US$) by Global Burden of Disease region and<br />
World Bank income classification<br />
27